US CPI preview and what comes next for the S&P 500, Nasdaq

Entry posted by MongiIG in Market News
181 views
The U.S. Bureau of Labor Statistics will release the CPI data for January 2023 on Tuesday, February 14 at 13:30 GMT.
 Source: Bloomberg
US stock markets ripped higher overnight in eager anticipation ahead of tonight's all-important US CPI data release.
Let's drill down into tonight's CPI.
But first - a warning
Every year the U.S. Bureau of Labor Statistics (BLS) recalculates seasonal adjustment factors for the CPI going back five years. (Year over Year data, which is not seasonally adjusted, is not revised). The most recent adjustments were released last week, and inflation readings for October and November were revised higher by 0.1%.
To make things more interesting, the BLS recently updated weightings for categories and has made some methodological changes.
The BLS is switching to a one-year lookback window for weighting instead of the former two-year window. The new weightings will see Owners' Equivalent Rent (OER), where inflation is likely to remain high, will increase by 1.2 percentage points (pp). While the weighting for Used Cars, which has turned deflationary, will decrease by 1.1pp.
This is representative of an increase in the weight of core goods within the basket while core services decreased. As we know, the price of core services has remained sticky, so the changes should reinforce the lower trajectory of inflation in the medium term.
However, in the short term, the changes bring an X factor to tonight's data that have the potential to challenge the immediate narrative that the disinflationary process is underway.
What is expected?
Headline inflation is expected to rise by 0.5% MoM due to higher gasoline prices. However, annual headline inflation is expected to fall to 6.2% YoY from 6.5% YoY, the lowest since October 2021.
Core inflation is expected to rise by 0.4% Mom, which would see the rate of annual inflation fall to 5.5% YoY from 5.7% YoY.
Possible CPI Scenarios and reactions
Presuming headline inflation does come in as expected at 6.2% (0.5% MoM) or lower, it will likely see U.S equity markets extend their January rally, to test and break recent highs.
However, should the number print at 6.5% or higher, stocks will sag, and the US dollar will rip higher. The market's expectation of the Fed's peak rate will likely be pushed above the 5.2% price for July this year.
S&P 500 technicals
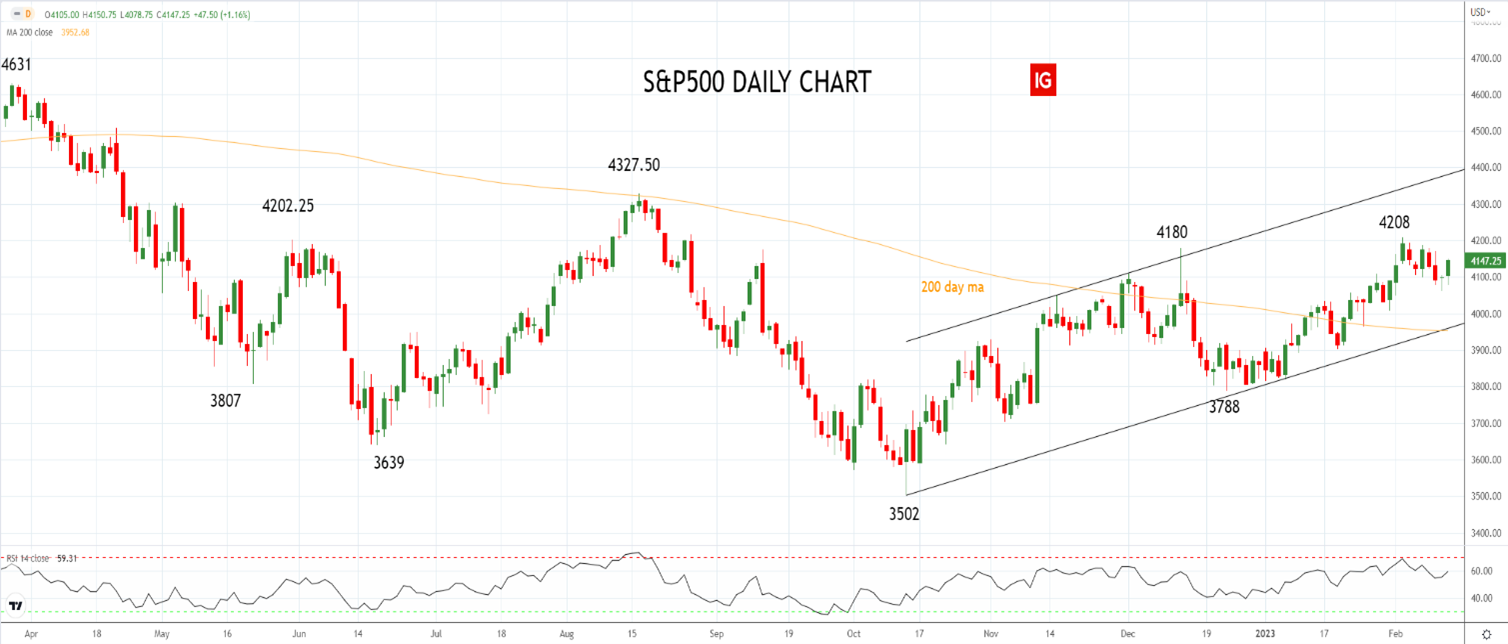
Providing the S&P 500 remains above uptrend support and the 200-day moving average (MA) of 3970/50, we continue to expect the rally from the October lows (which we view as countertrend or corrective) to reach the August 4327 high before fading.
Aware that a sustained close back below the 200-day MA and uptrend support 3970/50 would confirm that the rally from the October lows has been corrective and indicate that the downtrend has resumed.
S&P 500 daily chart
 Source: TradingView
Nasdaq technicals
Providing the Nasdaq remains above the support from the 200-day MA at 12,000, we expect the rally from the October lows to extend past resistance from the recent 12950 high towards the August 13,740 high, before fading.
Aware that a sustained close back below the 200-day MA of ~12,000 would confirm that the rally from the October lows has been corrective and the downtrend has resumed.
Nasdaq daily chart
 Source: TradingView


.jpeg.98f0cfe51803b4af23bc6b06b29ba6ff.jpeg)

0 Comments
Recommended Comments
There are no comments to display.
Create an account or sign in to comment
You need to be a member in order to leave a comment
Create an account
Sign up for a new account in our community. It's easy!
Register a new accountSign in
Already have an account? Sign in here.
Sign In Now