DJIA failed to defend its key 200-day MA: DJIA, USD/JPY, GBP/USD
It was another risk-off session in Wall Street, which failed to hold onto their initial gains despite the release of higher-than-expected US jobless claim figures.
 Source: Bloomberg
Market Recap
It was another risk-off session in Wall Street, which failed to hold onto their initial gains despite the release of higher-than-expected US jobless claim figures. The VIX was 18% higher as a reflection of surging fears, potentially with some attribution to the rout in the financial sector, apart from the increased hedging activities ahead of the US jobs release. While Treasury yields and the US dollar were surprisingly lower, that failed to calm the nerves in the equities space.
The financial sector was brought down by SVB Financial’s shocking plan to raise more than $2 billion in capital to meet its liquidity needs, as its tech-focused business approach has been heavily impacted by the higher interest rate environment. That may trigger some doubts on its solvency and wider concerns of a bank run, with the Financial Select Sector SPDR Fund dragged lower by more than 4% overnight. A breakdown of its 200-day moving average (MA) may suggest tougher times ahead for the bulls.
All eyes will be on the US jobs report today, where expectations are pointing to 205,000 job gains and unemployment rate at 3.4% (unchanged from January). Average hourly earnings are expected to rise to 4.7% year-on-year from previous 4.4%. The tendency for the job report to surprise on the upside (figures have exceeded expectations for ten months consecutively), along with a potential U-turn in wage gains, have called for some de-risking. Another round of upside surprise may further move bets towards a 50 basis-point (bp) hike in March – a shift that could be challenging for equities.
The consolidation support base for the DJIA at the 32,600 level has broken down overnight, along with its key 200-day MA for the first time since November 2022. That may leave further downside on the cards, with the next level on watch at the 31,800 level.
 Source: IG charts
Asia Open
Asian stocks look set for a negative open, with Nikkei -1.13%, ASX -1.64% and KOSPI -0.87% at the time of writing. Increased market fears as seen from the surge in VIX have overridden any positive effect of the weaker US dollar on the region, with US equities’ futures under pressure this morning as well. The Nasdaq Golden Dragon China Index was dragged more than 5% lower overnight, with the Hang Seng Index seemingly moving back to retest its key 200-day MA once more at the 19,600 level. Defending this level may be key for the bulls to sustain the ongoing upward trend.
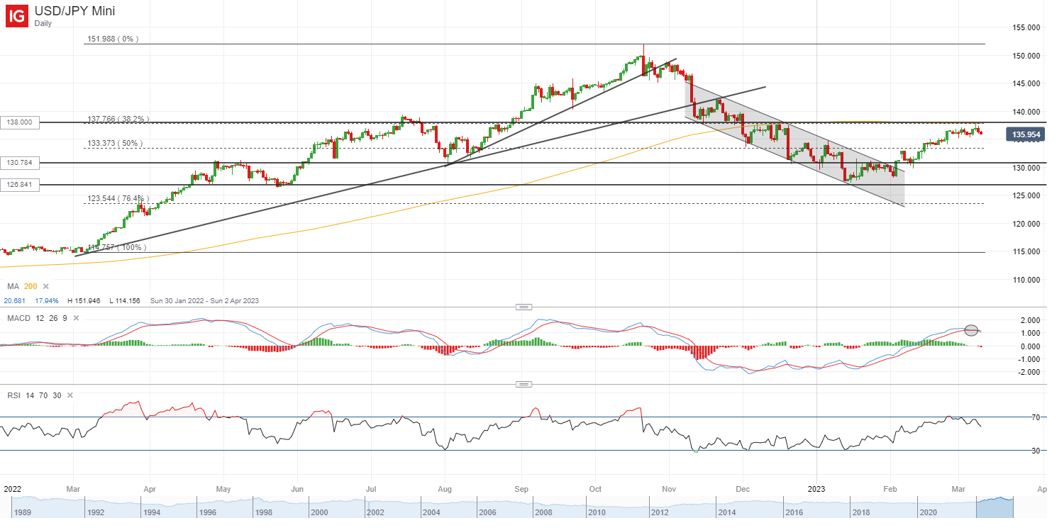
The Bank of Japan (BoJ) will be in focus today, with any surprise policy adjustments on watch although that remains the less likely scenario. Consensus is widely pointing to a no-change in policy approach for now. The USD/JPY continues to hang below its 200-day MA, in line with a 38.2% Fibonacci retracement level. The ranging pattern suggests some indecision in the near-term and failing to cross the MA line over the coming days may prompt a move to retest the 133.40 level for any formation of a higher low.
 Source: IG charts
On the watchlist: GBP/USD back to retest neckline of double-top formation
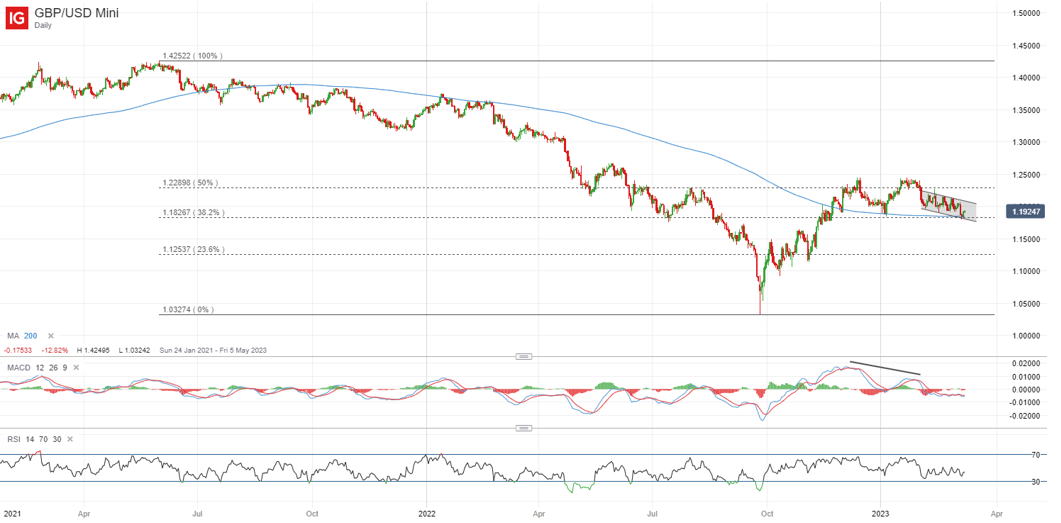
The GBP/USD has been guided by a near-term falling channel lately, with the series of lower lows bringing the pair to retest the 1.182 level. This level marked a key support confluence, where the neckline of a double top formation stands in line with its 200-day MA. The double top projection suggests that failure to defend this level could see the pair move to retest the 1.125 level next. The US dollar will be key to watch, with sentiments revolving around the US non-farm payroll report release today. Another blowout figure in the likes of January may anchor a reversal back to 50 bp hike in the March Federal Open Market Committee (FOMC) meeting, which may be viewed as US dollar positive. That could translate to downward pressure for the GBP/USD, with risks of a breakdown for the neckline.
 Source: IG charts
Thursday: DJIA -1.66%; S&P 500 -1.85%; Nasdaq -2.05%, DAX +0.01%, FTSE -0.63%


0 Comments
Recommended Comments
There are no comments to display.
Create an account or sign in to comment
You need to be a member in order to leave a comment
Create an account
Sign up for a new account in our community. It's easy!
Register a new accountSign in
Already have an account? Sign in here.
Sign In Now