US earnings preview: Nasdaq's Netflix Q2 revenue growth forecast at low to mid single digits
The upcoming Netflix results are expected to show a 3% increase in revenue for Q2 2023, or 6% growth on a foreign exchange neutral basis.
 Source: IG
Key Takeaways:
- Netflix is set to report its Q2 2023 earnings on July 19th, and the company has projected an optimistic financial forecast for the fiscal year 2023
- The company's main financial indicators for profitability include revenue growth and operating margin, and Netflix aims to maintain double-digit revenue growth, expand operating margins, and generate increasing positive free cash flow
- Netflix anticipates a 3% increase in revenue for Q2 2023, reaching $8.2 billion, or 6% growth on a foreign exchange neutral basis
- The introduction of paid sharing has been well-received, and the company has rescheduled the broad launch from late Q1 to Q2, which means that some expected membership growth and revenue benefit will be reflected in Q3 instead of Q2
- Netflix expects constant currency revenue growth to accelerate in the second half of 2023, facilitated by the broader rollout of paid sharing and the expansion of its advertising business. The company also targets a 2023 operating margin of 18%-20% and anticipates year-over-year operating profit growth
When is the Netflix Inc. earnings date?
Netflix Inc. (NASDAQ: NFLX), the Nasdaq listed, world leading internet television network will report its second quarter earnings for 2023 (Q2 2023) on Wednesday the 19th of July.
Netflix results Q2 2023 earnings preview, what does ‘The Street’ expect?
Netflix Inc. has projected an optimistic financial forecast for the fiscal year 2023. The company's main financial indicators remain revenue growth and operating margin for profitability. The firm's long-term financial goals remain consistent, aiming to maintain double-digit revenue growth, expand operating margins, and generate increasing positive free cash flow.
The company is on course to meet its financial objectives for the full year 2023. For the second quarter of 2023, the company anticipates a revenue of $8.2 billion, a 3% increase year over year, or 6% growth on a foreign exchange neutral basis.
The recent introduction of paid sharing has been met with positive reception. Despite opportunities to launch broadly in the first quarter, the company identified ways to enhance the user experience. With each launch, the company gains valuable insights, leading to improved results. As a result, the broad launch was rescheduled from late Q1 to Q2. This delay implies that some expected membership growth and revenue benefit will be reflected in Q3 instead of Q2.
The majority of Netflix's year-over-year foreign exchange neutral revenue growth in Q2 is anticipated to come from an increase in its paid membership base. This is expected to result in Q2 paid net additions like Q1'23 and a slight increase in year-over-year foreign exchange neutral Average Revenue Per User (ARM).
For Q2'23, Netflix forecasts an operating income of $1.6 billion, roughly flat year over year, and an operating margin of 19%, compared to 20% in Q2'22. The year-over-year decline in operating margin is due to the appreciation of the US dollar against most other currencies over the past year.
As the company continues to enhance its service, it expects constant currency revenue growth to accelerate in the second half of 2023. This will be facilitated by the broader rollout of paid sharing in Q2 and the expansion of its advertising business. The company also anticipates year-over-year operating profit growth and operating margin expansion for the full year, targeting a 2023 operating margin of 18%-20%.
A consensus of estimates from Refinitiv arrives at the following expectations for the Q2 2023 Netflix results:
- Revenue $8.27bn (+3.70% y/y)
- Net income on an adjusted basis $1.270bn (-11.01% y/y)
- Earnings Before tax Depreciation and Amortization (EBITDA) $1.789bn (-1.30% y/y)
- EPS of $2.84 (-11.37% y/y)
Netflix's ability to meet its long-term financial targets will depend on increasing engagement and improving monetization to fuel revenue growth and increased profitability. This provides a promising outlook for traders looking to invest in a company with a solid growth strategy and a robust financial forecast.
How to trade the Netflix results
 Source: Refinitiv
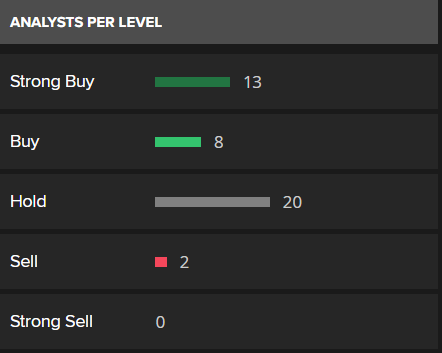
A Refinitiv poll of forty-three analysts maintain a long-term average rating of buy for Netflix (as of the 10th of July 2023.
Netflix Inc.: trading view
 Source: IG
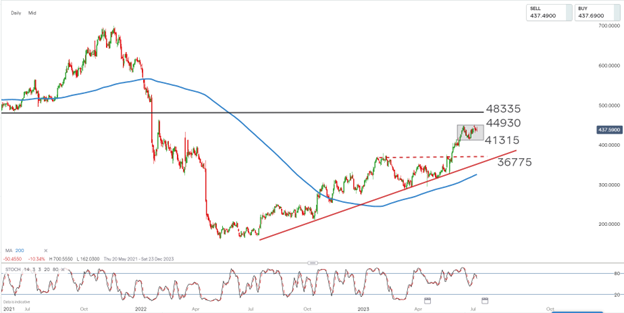
The share price of Netflix trades within a short-term range between levels 41315 (support) and 44930 (resistance). The long-term trend for the share remains up as we see the price trading firmly above the 200-day simple moving average (blue line) (200MA).
The longer-term uptrend suggests keeping a long bias to trades on the company. Long entry might be considered on either a bullish price reversal near range support (41315) or a break of (close above) range resistance (44930). In this scenario 48335 becomes a longer-term upside resistance target.
Should the price instead move to break a confluence of support at around 41315, 36775 becomes the next support target. In this scenario trend followers might prefer to wait for weakness to play out before looking for a bullish price reversal closer to the 36775 level for long entry.


.jpeg.98f0cfe51803b4af23bc6b06b29ba6ff.jpeg)
0 Comments
Recommended Comments
There are no comments to display.
Create an account or sign in to comment
You need to be a member in order to leave a comment
Create an account
Sign up for a new account in our community. It's easy!
Register a new accountSign in
Already have an account? Sign in here.
Sign In Now