All eyes on US CPI ahead: DJIA, USD/JPY, NZD/USD

Entry posted by MongiIG in Market News
442 views
The usual cautious lead-up to the US CPI release has failed to deter risk appetite in Wall Street overnight, as major US indices pushed higher on strength in value sectors.
 Source: Bloomberg
Market Recap
The usual cautious lead-up to the US consumer price index (CPI) release has failed to deter risk appetite in Wall Street overnight, as major US indices pushed higher on strength in value sectors (energy, industrials, financials). The market confidence could arise as broad expectations are positioned for the upcoming US CPI to reflect further moderation in pricing pressures, with the headline figure expected to decline to 3.1% year-on-year from previous 4%. Likewise, the core aspect is expected to decline to 5.0% year-over-year from 5.3% in May. Month-on-month, both the headline and core inflation prints are expected to increase by 0.3%.
Another dip in the US core CPI read may reinforce some degree of success in Fed’s tightening moves thus far and leaves room for the Fed to consider a prolonged rate pause for more policy flexibility. Any upside surprise in inflation may put chatters of more rate hikes on the table but given that a 25 basis-point (bp) hike is already heavily priced for the upcoming Fed meeting (88% probability from US Fed funds futures) and the broader trend for inflation is still to the downside, it may potentially have to take a significant beat in inflation numbers to drive a pronounced recalibration in rate pricing.
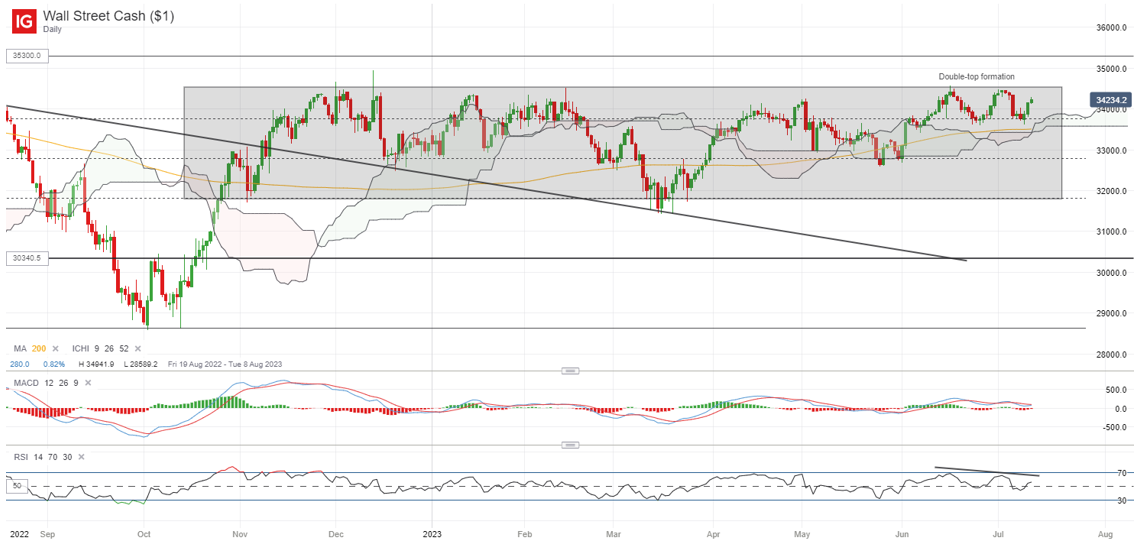
The DJIA has largely traded in a wide consolidation pattern since November last year, with a retest of the upper consolidation range marked with the formation of a double-top pattern. Bearish divergences on Relative Strength Index (RSI) and moving average convergence divergence (MACD) seem to point to moderating upward momentum on recent peaks but nevertheless, buyers have managed to defend the double-top neckline overnight at the 33,600 level. Another retest of the upper range may be on watch at the 34,500 level, with any successful upward break potentially leaving the 35,300 level in sight.
 Source: IG charts
Asia Open
Asian stocks look set for a mixed open, with Nikkei -0.35%, ASX +0.67% and KOSPI -0.13% at the time of writing. Chinese equities have managed to see some gains yesterday, with the small step from China authorities in extending stimulus support for the property sector providing hopes for more to come over the coming months. The Nasdaq Golden Dragon China Index is up 1.6% overnight after an initial dip. That said, past instances suggest that signs of policy success in lifting economic conditions may still be needed to drive more sustained gains. China’s economic surprise index has turned in a new two-year low recently, with the worst-is-over conditions still on the lookout among investors.
The economic calendar this morning saw a downside surprise in Japan’s producer prices (4.1% versus 4.3% forecast), with its sixth consecutive month of decline seemingly pointing towards some easing upward pressure on consumer prices. With views of a quicker policy shift by the Bank of Japan (BoJ) on the surge in Japanese workers’ wages lately, today’s wholesale inflation data may slightly dampen some hawkish expectations.
A brief breakout for the USD/JPY above its ascending channel pattern has failed to find much follow-through, as interaction at the 145.00 level was faced with strong resistance. The level marked a previous area of intervention by Japanese authorities, which prompted some retreat from buyers. The pair is currently back to retest its 139.60 level of support, with any failure for the level to hold potentially paving the way towards the 136.60 level, where the lower channel trendline resides.
 Source: IG charts
On the watchlist: NZD/USD still stuck below resistance confluence ahead of RBNZ meeting
Aggressive tightening by the Reserve Bank of New Zealand (RBNZ) thus far has forced its economy into a technical recession, which led market rate expectations to be fully priced for rates to be on hold (5.5%) at the upcoming meeting. This follows after 525 basis-point worth of rate hikes have been delivered to bring its official cash rate to its 14-year high. Nevertheless, the central bank is expected to retain its hawkish stance, given that inflation at 6.7% remains too high for comfort (central bank’s target band is at 1% to 3%). This places a potential hawkish pause scenario on the table, where further rate hikes ahead remain an option if inflation proves to be more persistent.
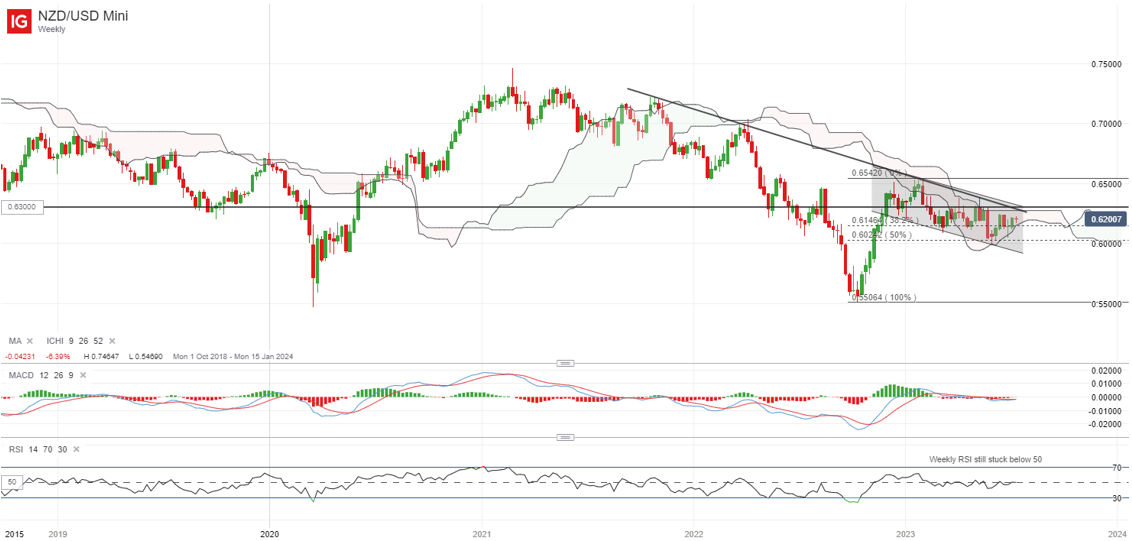
On the weekly chart, the NZD/USD has been trading within a descending channel pattern since the start of the year, with a key resistance confluence at the 0.630 level. This is where the upper channel trendline resistance coincides with the upper edge of the weekly Ichimoku cloud, while its weekly RSI still struggles to overcome its 50 level for now. A reclaim of the 0.630 level may be needed to pave the way to retest its year-to-date high at the 0.654 level next. On the downside, the channel support will place the 0.591 level on watch, if the pair resumes its prevailing downward trend.
 Source: IG charts
Tuesday: DJIA +0.93%; S&P 500 +0.67%; Nasdaq +0.55%, DAX +0.75%, FTSE +0.12%


.jpeg.98f0cfe51803b4af23bc6b06b29ba6ff.jpeg)

0 Comments
Recommended Comments
There are no comments to display.
Create an account or sign in to comment
You need to be a member in order to leave a comment
Create an account
Sign up for a new account in our community. It's easy!
Register a new accountSign in
Already have an account? Sign in here.
Sign In Now