Is the Nikkei 225 topping out?

Entry posted by MongiIG in Market News
1,052 views
Nikkei 225 poll
1 member has voted
Are there dark clouds on the horizon for the Nikkei 225?
 Source: Bloomberg
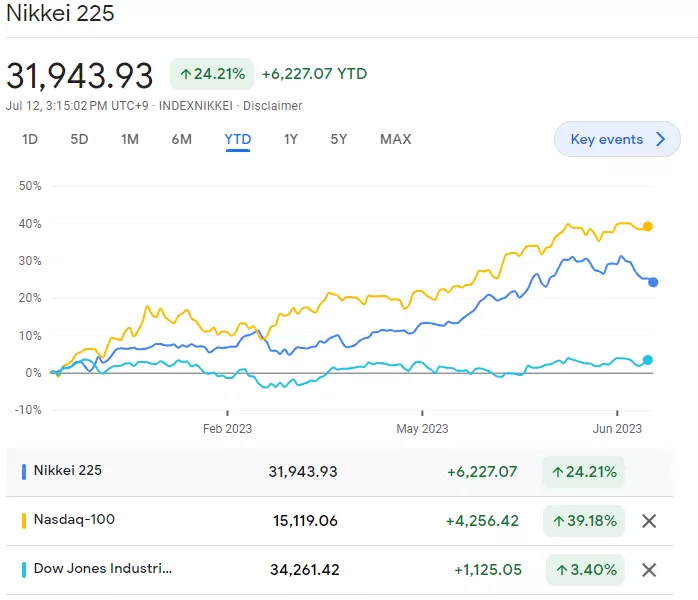
Nikkei 225: one of the top performing global stock indices to date
The Nikkei 225 ended the first half of the year narrowly behind the Nasdaq as foreign investors piled in but the beginning of the second half of the year looks less rosy.
According to DailyFX strategist Richard Snow “the Nikkei has been one of the top performing equity indices in the world during the first half of 2023, bested only by the high-flying, tech heavy Nasdaq. In fact, the Nikkei ended 1H having risen 27.8%, only a little less than the Nasdaq at 29.86%.”
Year-to-date Nikkei 225, Nasdaq 100 and Dow Jones Industrial Average comparison chart
 Source: Google Finance
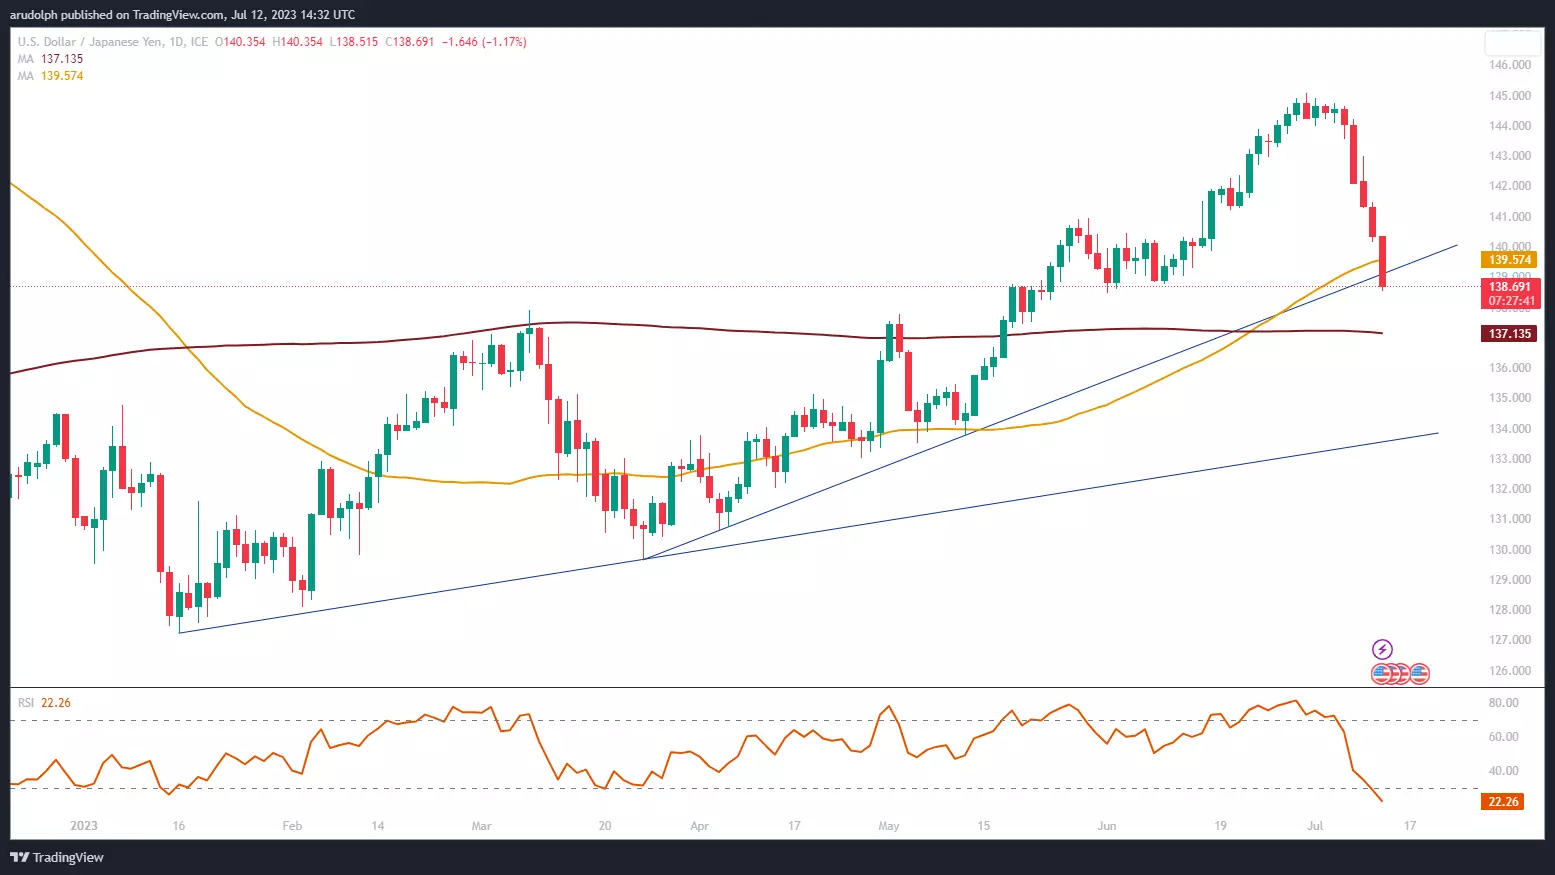
Ongoing monetary support from the new Bank of Japan (BoJ) Governor Kazuo Ueda and a weaker yen have made Japanese stocks an attractive proposition for fund managers.
The ultra-lose monetary policy allows for ample access to credit while the yen depreciation improves company profitability and makes Japanese stocks cheaper to buy for foreign buyers.
USD/JPY Daily Candlesticks Chart
 Source: Tradingview
The recent yen appreciation on news of broad participation in this year's wage increases has had a detrimental effect on the Nikkei 225 rally as it points to possible policy normalisation.
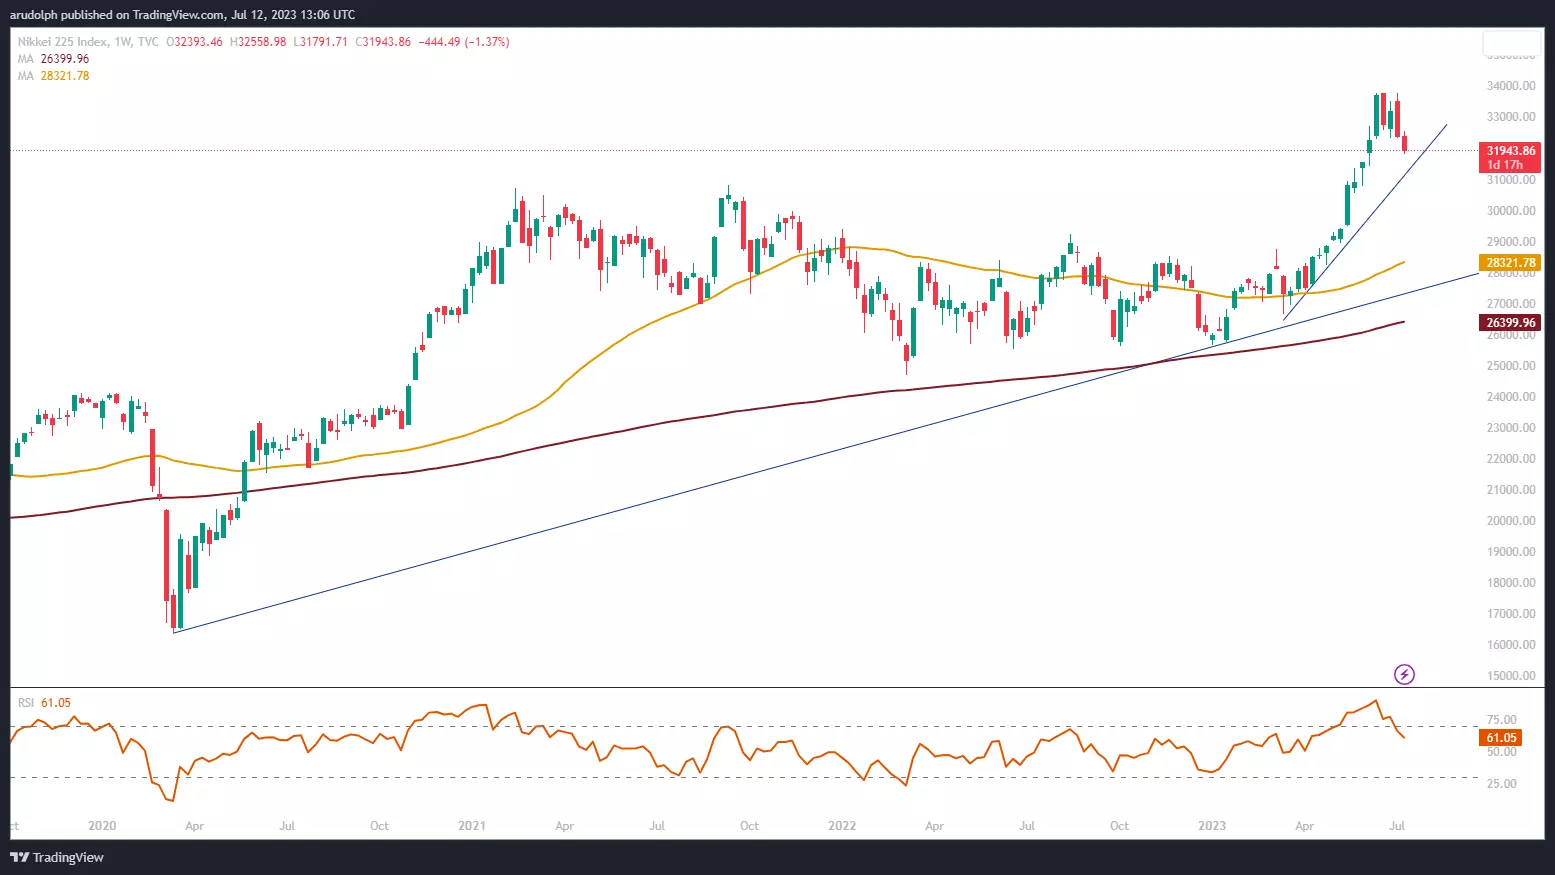
Technical analysis outlook on the Nikkei 225
The Nikkei 225 formed a double top on its weekly and daily charts with last week’s Bearish Engulfing pattern on the weekly chart being followed by this week’s slide, a clear technical sign of at least an interim top being formed.
Nikkei 225 Weekly Candlestick Chart
 Source: Tradingview
The March-to-June uptrend line at 31,145.30 represents a potential first downside target, followed by the double top downside target at 30,841.09 and the February and September 2021 highs at 30,795.78 to 30,714.52.
The pattern downside target can be found by taking the distance from the 33,772.89 June peak to the 32,306.99 late-June low and project it lower from that low. This gives a target of 32,306.99 – 1,465.90 = 30,841.09.
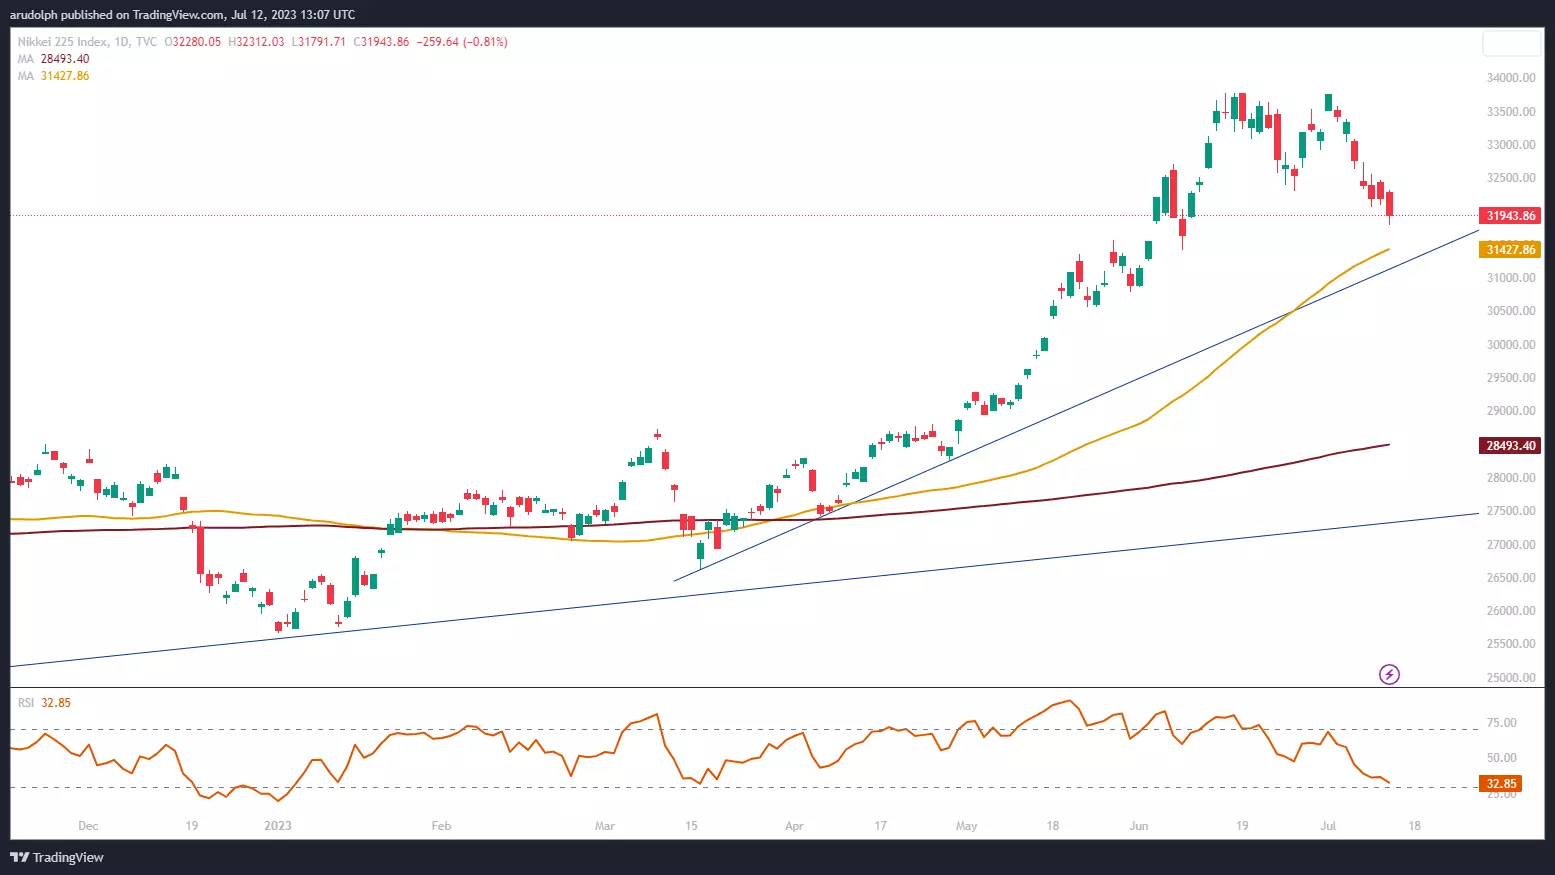
Nikkei 225 Daily Candlestick Chart
 Source: Tradingview
On the way down the 55-day simple moving average (SMA) and 8 June low at 31,427.86 to 31,420.45 may offer short-term support.
Only a currently not expected bullish reversal, rise and daily chart close above the recent highs at 33,762.81 to 33,772.89 would invalidate the bearish double top pattern which can be spotted better on the daily chart as it looks like an “M.”


0 Comments
Recommended Comments
There are no comments to display.
Create an account or sign in to comment
You need to be a member in order to leave a comment
Create an account
Sign up for a new account in our community. It's easy!
Register a new accountSign in
Already have an account? Sign in here.
Sign In Now