Apple’s Q3 earnings preview: Resilience may be the story but has much been priced?

Entry posted by MongiIG in Market News
552 views
Apple’s share price: what to expect from its Q3 results
 Source: Bloomberg
When does Apple Inc report earnings?
Apple Inc is set to release its quarter three (Q3) financial results on 3 August 2023, after market closes.
Apple’s earnings – what to expect
Current market expectations are for Apple’s Q3 revenue to decline 1.7% from a year ago, turning in its third straight quarter of contraction but coming off a smaller decline from the -2.5% in Q2.
Likewise, earnings per share (EPS) are expected to decline 0.7% year-on-year, a softer read than the flat growth in Q2. However, its EBITDA margin is expected to remain resilient at 31.8%, just a slight downtick from the 32.9% in the previous quarter.
Being a heavyweight in the Nasdaq, its year-to-date gain of 54.5% has contributed significantly to the index’s outperformance. Undoubtedly, all eyes will be on its upcoming earnings release to determine whether the Nasdaq’s rally has further room to run in the near term.
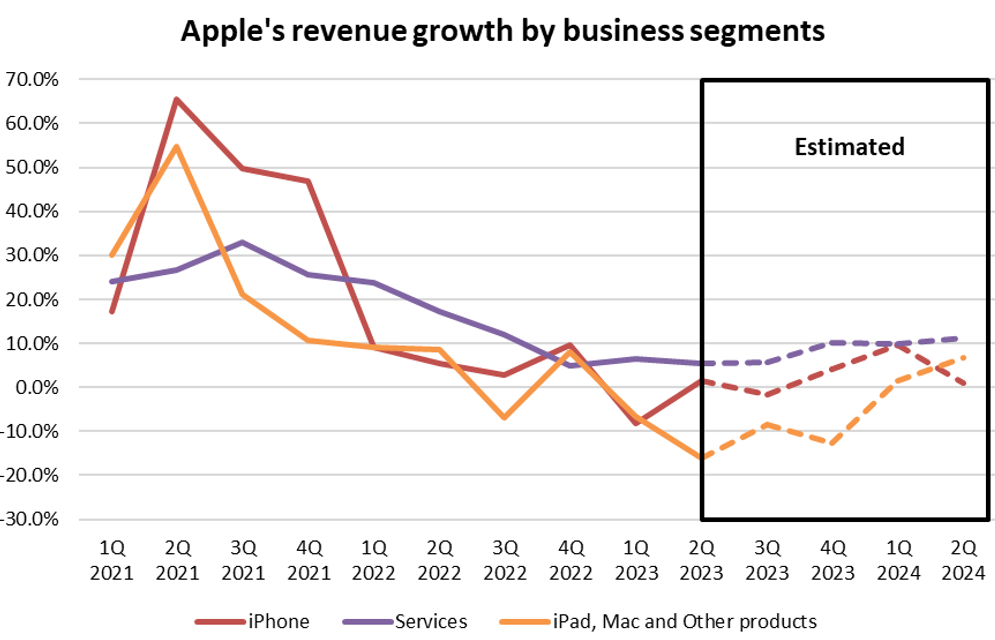
Subdued Greater China’s recovery could remain a drag, Apple services to stay resilient
The Greater China market accounts for one-fifth of Apple’s revenue and thus far, recovery on that front has not been as promising as what many initially expected. A look at the China’s economic surprise index has revealed its lowest level since May 2020, which points to the challenging economic conditions for one of Apple’s iPhone key markets.
Amid this backdrop, iPhone sales for Q3 2023 are expected to contract 1.5% from a year ago, before a stronger recovery can be seen through the rest of the year. Other product demand are also expected to stay weak, with iPad and Mac sales expected to decline by 11.6% and 14.1% year-on-year respectively.
The more consistent showing will be its services segment, which is expected to grow 5.8% in Q3 2023, up slightly from the 5.5% in the previous quarter. The segment has delivered an all-time record with $20.9 billion in revenue in the previous quarter measured and the momentum seems primed to continue, given the stickiness of the ecosystem. That may aid to cushion the prevailing weaknesses in hardware sales in the meantime, until conditions improve on those fronts.
 Source: Refinitiv
Market pricing for a subsequent recovery and future growth potential
Nevertheless, with Apple’s share price pushing to a new all-time high, much may be priced for future recovery, with Q3 2023 expected to validate views of a potential bottom in both its top and bottom-line growth. In the previous quarter’s earnings call, the management’s guidance has carried some reservations around the macroeconomic environment, and eyes will be on whether a more optimistic tone could be struck this time round with the mounting views of a ‘soft landing’.
With a forward price-to-sales valuation of 7.5, a premium also seems to be priced for future growth potential. This valuation is more lofty than that of Meta Platforms (5.9) and Alphabet (4.9), but on par with Tesla (8.0).
Several growth catalysts remain on watch to potentially diversify the company’s revenue stream away from iPhone sales (54% of total revenue) over the longer term. While monetisation efforts will not be reflected in the upcoming results, clues will be sought on the respective launch plans and initial progress to support Apple’s growth momentum into next year.
This includes the New Vision Pro headset announced last month, which is expected to launch early next year. Apple is also tapping on its huge user base to include financial services as part of its ecosystem, such as offering a high-yield saving account program for Apple Card holders and “buy now, pay later” offerings (Apple Pay Later). Not to mention its recent venture to join the Artificial Intelligence (AI) chatbot race with its Apple GPT tool.
Apple also typically releases new iPhones in September and is expected to take the wraps off the new iPhone 15 range this year. While an announcement may be made closer to late-August, this will be something to put on the radar, especially with recent chatters of display manufacturing issues potentially causing some delays. More clarity will be sought on that front from the upcoming earnings call.
Share buyback and dividends?
Apple generally raised its dividend in the January-March reporting season, which it has done so with a 4% increase to $0.24 per share this year. It also guided for a US$90 billion stock buyback then, which provides a vote of confidence for its cashflow over coming quarters. For the coming quarter, its free cashflow is expected to rise 5.9% from a year ago.
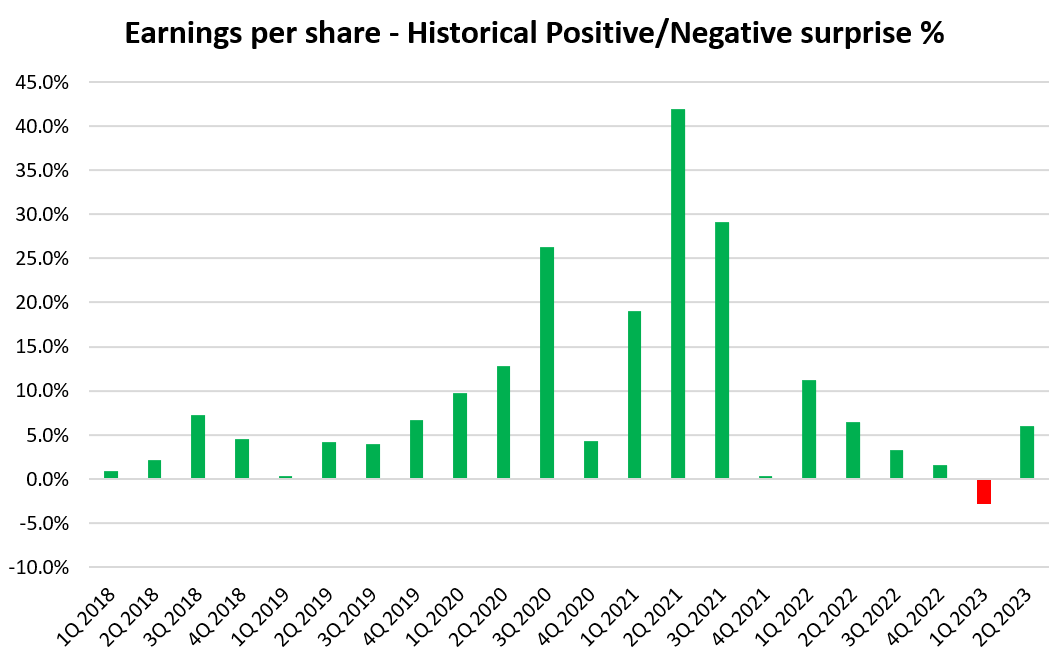
Strong record of earnings outperformance, but forward guidance will be key
Apple generally has a strong track record of beating earnings estimates. Since FY2018, it has only missed earnings estimate once out of the past 22 quarters. On a revenue basis, it has also outperformed on 20 out of the past 22 quarters since FY2018. Therefore, the odds seem to be heavily leaning towards another positive surprise at the upcoming results.
That said, recent results from Netflix and Tesla will serve as a warning to market participants that forward guidance will be key as well, to validate broad expectations for a recovery in corporate earnings through the rest of the year.
 Source: Refinitiv
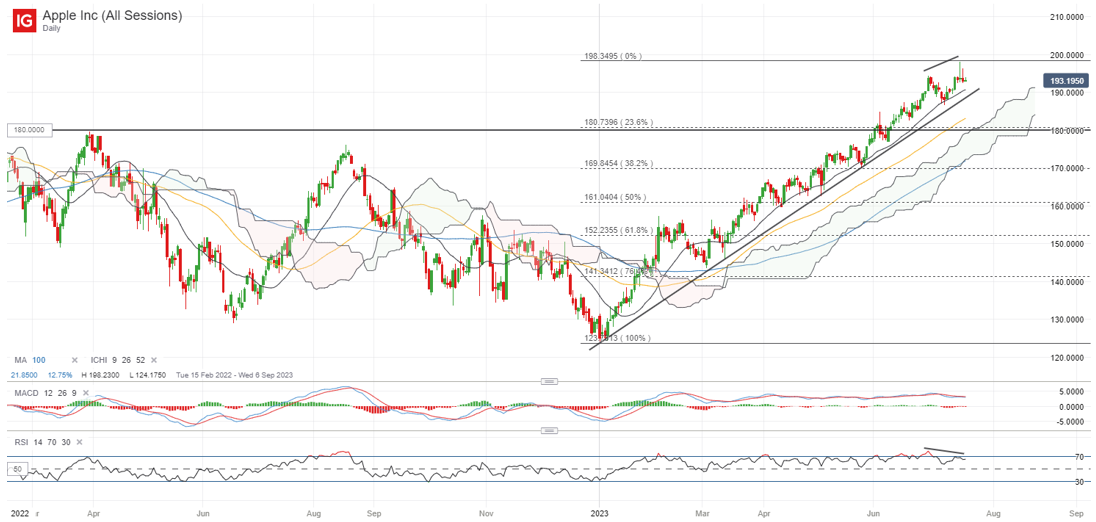
Technical analysis – Upward trend intact but near-term bearish RSI divergence on watch
Apple’s share price has been on a tear, gaining as much as 60% year-to-date. While the series of higher highs and higher lows provide conviction of a clear upward trend in place, the recent tops are marked with a bearish divergence on its Relative Strength Index (RSI), which points towards some exhaustion in upward momentum. The recent formation of bearish shooting star candles on the daily chart also raises the odds of a near-term retracement.
Nevertheless, any retracement could still leave a series of support lines on watch to resume its upward trend. This includes a key upward trendline, alongside its 20-day moving average (MA) in the near term. Perhaps a major level of support will be at the US$180.00 level, where the upper edge of its Ichimoku cloud zone coincides with a 23.6% Fibonacci retracement on its year-to-date rally.
 Source: IG charts


0 Comments
Recommended Comments
There are no comments to display.
Create an account or sign in to comment
You need to be a member in order to leave a comment
Create an account
Sign up for a new account in our community. It's easy!
Register a new accountSign in
Already have an account? Sign in here.
Sign In Now