Profit-taking in big tech overnight, as US earnings remain centre stage: US dollar, Nikkei 225, AUD/JPY

Entry posted by MongiIG in Market News
464 views
Wall Street ended mixed overall, with further catch-up gains in value sectors as the DJIA delivered its ninth day winning streak.
 Source: Bloomberg
Market Recap
Earnings from Netflix and Tesla have triggered some profit-taking in big tech companies overnight, as pockets of weaknesses in their results seem to give rise to concerns for other upcoming big tech results as well. Given the stellar tech rally since the start of the year, market participants may be pricing for not just an earnings beat, but a strong guidance in corporate earnings over the coming quarters with current ‘soft landing’ hopes. Any signs to challenge that narrative may call for some re-rating in their present lofty valuation.
Wall Street ended mixed overall (DJIA +0.47%; S&P 500-0.68%; Nasdaq -2.05%), with further catch-up gains in value sectors as the DJIA delivered its ninth day winning streak. Weaker-than-expected read in the Philadelphia Fed Manufacturing Index (-13.5 versus -10 forecast) and a deeper contraction in the Conference Board Leading Economic Index have been largely shrugged off, with the earnings season taking centre stage and expectations well-positioned for the last rate hike from the Fed next week. Treasury yields largely headed higher, with the 10-year yields jumping 10 basis-point (bp) overnight.
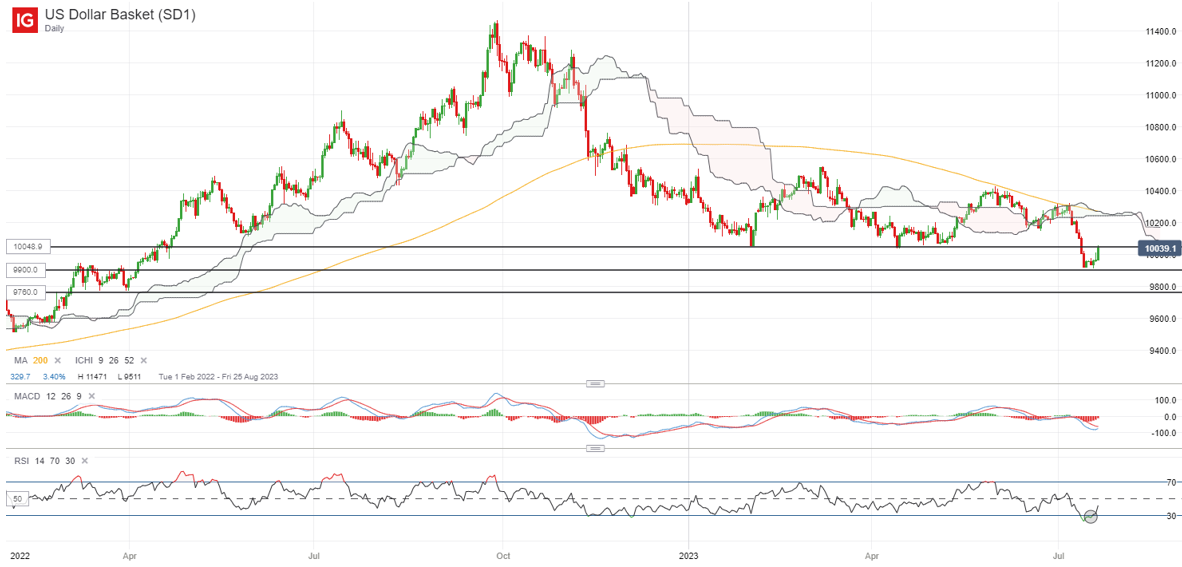
One to watch may be the US dollar, which is back to retest its previous support-turned-resistance level at the 100.50 level. For now, the broader trend of lower highs and lower lows could still suggest sellers largely in control, while there are the odds that the recent upmove is a near-term moderation from oversold technical conditions following a hefty 4% sell-off over the past two week. Failure to reclaim the 100.50 level over the coming days could leave its July 2023 low on watch at the 99.00 level for a retest.
 Source: IG charts
Asia Open
Asian stocks look set for a negative open, with Japan 225 -0.69%, ASX-0.22% and KOSPI -0.75% at the time of writing. The economic calendar is relatively quiet to end the week, with focus this morning revolving around the Japan’s inflation data for June. The headline print was lower than expected (3.3% versus 3.5% year-on-year), but the core aspect continue to show some persistence with a match of consensus at 4.2%.
That may still keep speculations of a policy adjustment from the Bank of Japan (BoJ) in place, with the Japanese 10-year bond yields hovering near its two-month high into the BoJ meeting next week. While there has been some pushback from authorities lately for a July move, the consensus remains that a policy shift will be a matter of when and could eventually take place by the end of this year.
Any hawkish shift in policy settings may be negative for the Nikkei 225 index, as seen from the 2% sell-off back in December 2022 on the BoJ’s surprise yield curve control (YCC) tweak. But while that is still perceived to be a few meetings away, the index is currently attempting to defend a key double-top neckline at the 32,400 level. The recent lower highs on its Relative Strength Index (RSI) point to some exhaustion in upward momentum for now, while the index attempts to stay above its 100-day moving average (MA) for now. Failure to defend the 32,400 level may potentially pave the way towards the next line of support at the 31,400 level.
 Source: IG charts
On the watchlist: AUD/JPY back to retest key resistance once more
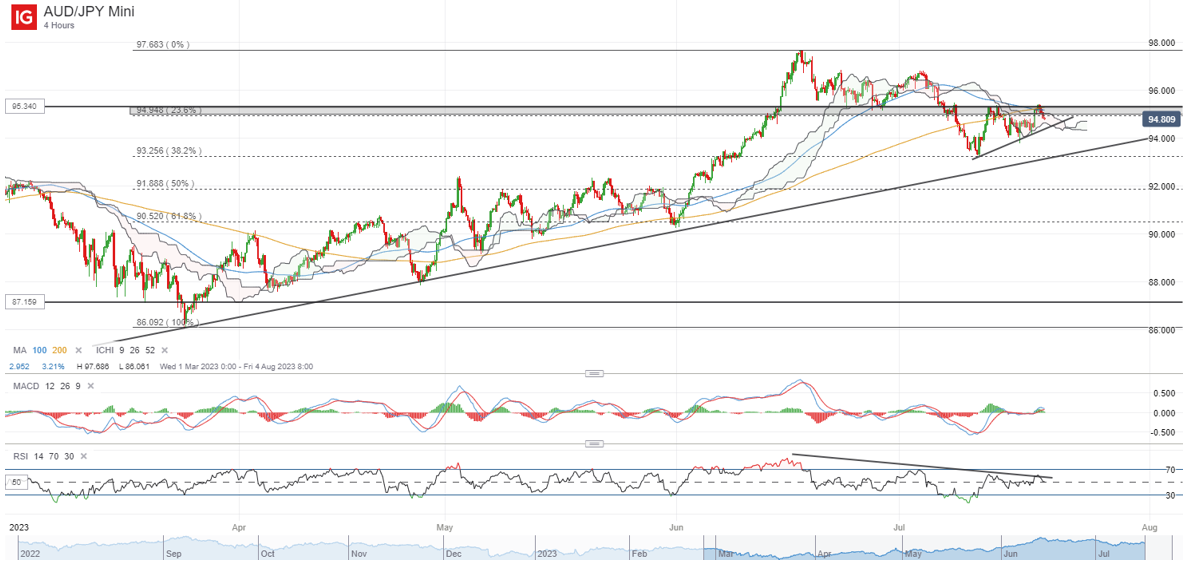
A hotter-than-expected jobs data out of Australia yesterday has prompted a hawkish recalibration in rate expectations for the Reserve Bank of Australia (RBA), as market participants price for a higher odds of a 25 bp move from the central bank next month. That triggered an initial jump in the AUD/JPY before the more subdued risk environment dampened some optimism around the risk-sensitive AUD.
With that, the AUD/JPY is once again back to retest its key resistance at the 95.34 level, with a near-term ascending triangle pattern in place on the four-hour chart. Buyers may have to overcome the 95.34 level to provide greater conviction for a move to retest its June 2023 high, but for now, the risks of a lower high is still present, with any downside potentially leaving the 93.20 level on watch as immediate support.
 Source: IG charts
Thursday: DJIA +0.47%; S&P 500 -0.68%; Nasdaq -2.05%, DAX +0.59%, FTSE +0.76%


.jpeg.98f0cfe51803b4af23bc6b06b29ba6ff.jpeg)

0 Comments
Recommended Comments
There are no comments to display.
Create an account or sign in to comment
You need to be a member in order to leave a comment
Create an account
Sign up for a new account in our community. It's easy!
Register a new accountSign in
Already have an account? Sign in here.
Sign In Now