Mixed showing in big tech results, with all eyes on FOMC meeting next: Microsoft, AUD/NZD, US dollar

Entry posted by MongiIG in Market News
586 views
Asian stocks look set for a subdued open, following a mixed showing in Microsoft and Alphabet’s result releases after-market.
 Source: Bloomberg
Market Recap
Wall Street saw a drift higher overnight (DJIA +0.08%;S&P 500 +0.28%; Nasdaq+0.61%), uplifted by outperformance in the technology (+1.2%) and materials (+1.8%) sectors, but after-market moves were more subdued following Microsoft and Alphabet’s result releases.
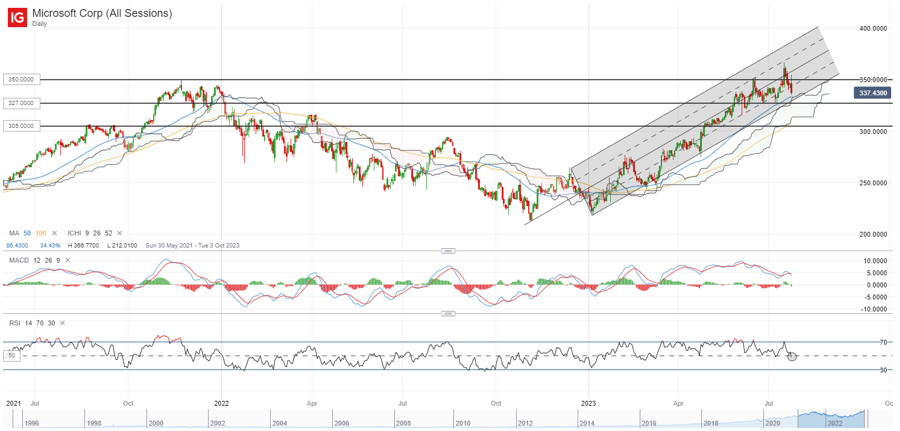
Both big tech companies beat top and bottom-line estimates, but market participants are finding some unease with the weaker-than-expected revenue guidance from Microsoft, which overshadowed its current Q4 resilience. Continued weakness in the PC market was to be blamed, likely to be cushioned by consistent growth momentum in its Intelligent Cloud segment, but coming off a 46.5% year-to-date rally, much may be priced for perfection. Its share price is down 4% after-hours.
The US$327.00 level could serve as a key support confluence level (trendline support, 50-day MA, Ichimoku) to hold in the near term, with the broader trend still leaving the formation of any new higher low on watch. But for now, some defending will have to come from buyers tonight, as its relative strength index (RSI) is flirting with the key 50 level. Past three interactions since April this year were met with some support, so one to watch if it can hold this time round as well.
 Source: IG charts
On the other hand, Alphabet managed to surprise on a stronger-than-expected rebound in advertising and steady growth in its cloud-computing unit, which may validate the resilience in economic conditions thus far. Improving year-on-year revenue growth for the second straight quarter also provides some conviction for the worst-is-over view, with further recovery expected over coming quarters.
Ahead, all eyes will be on the Federal Open Market Committee (FOMC) meeting outcome. The Fed funds futures suggest that a 25 basis-point (bp) hike has been fully priced, but expectations for subsequent rate path remain misaligned with policymakers’ views. Broad market pricing are looking for an extended rate pause through the rest of the year, while Fed officials could likely leave the door open for one more rate hike in the September or November meeting. Interpretation of the Fed’s rate path will revolve heavily around Fed Chair Jerome Powell’s press conference.
Asia Open
Asian stocks look set for a subdued open, with Nikkei -0.34%, ASX +0.13% and KOSPI -0.54% at the time of writing. Chinese equities had a strong positive reaction yesterday to China’s recent stimulus pledge, with the Hang Seng Index up 4.3% in a single trading session. But much will still depend on the Politburo meeting outcome for any follow-through, with strong stimulus hopes in place also providing room for disappointment if the stimulus details were to lack conviction.
The economic calendar will leave Australia’s Q2 inflation rate on the radar. Despite keeping its rate on hold at the previous meeting, the Reserve Bank of Australia (RBA) has shown a clear intention to be on the lookout for incoming data to guide its next decision. Off the back of recent firm labour data, rate expectations saw a hawkish build-up for another 25 bp hike from the central bank over coming months, but better-than-expected progress in inflation may likely challenge that. Current expectations are for headline inflation to fall to 6.2% YoY from 7%. The RBA's preferred measure of core inflation, the Trimmed Mean, is expected to fall to 6.0% YoY from 6.6% previously.
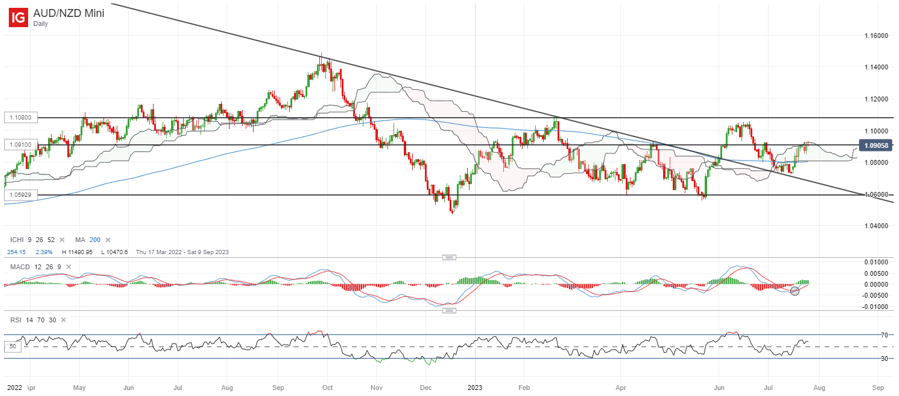
Perhaps one to watch may be the AUD/NZD, which has recently bounced off a resistance-turned-support trendline but is currently hovering just below its 1.091 level of resistance. A move in the RSI back above the 50 level marked an attempt for buyers to retain control, as moving average convergence/divergence (MACD) attempts for a cross above the key zero line. Any successful move above the 1.091 level could potentially pave the way to retest its year-to-date high at the 1.108 level next.
 Source: IG charts
On the watchlist: US dollar on watch in the lead-up to the FOMC meeting outcome
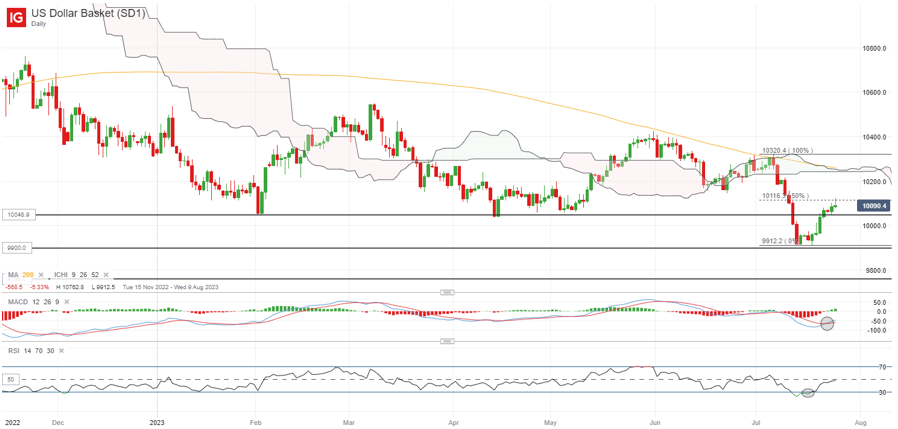
The US dollar has attempted to reclaim its key psychological 100.00 level ahead of the FOMC meeting outcome but some reservations are still in place, with a bearish shooting star candle in formation on the daily chart overnight. This follows after a retest of the 50% Fibonacci retracement level from the recent sell-off. The recent CFTC data also revealed that the aggregate dollar positioning versus G10 currencies have headed further into net-short territory last week, turning in its highest net-short positioning since June 2021.
While the Fed is likely to keep the door open for another rate hike after July, we are still nevertheless treading in the final phase of the Fed’s hiking cycle. A hawkish tone from the central bank could be supportive of the US dollar, but given the broader downward trend on lower highs and lower lows, any upside could still leave any formation of a new lower high on watch. Near term, the 101.30 may serve as immediate resistance to overcome, while on the other hand, failing to hold the key 100.00 level could pave the way back towards its July low at the 99.20 level for a retest.
 Source: IG charts
Tuesday: DJIA +0.08%; S&P 500 +0.28%; Nasdaq +0.61%, DAX +0.13%, FTSE +0.17%


0 Comments
Recommended Comments
There are no comments to display.
Create an account or sign in to comment
You need to be a member in order to leave a comment
Create an account
Sign up for a new account in our community. It's easy!
Register a new accountSign in
Already have an account? Sign in here.
Sign In Now