Coinbase Q2 Earnings: Is the Worst Time Over or Just on the Way?

Entry posted by MongiIG in Market News
532 views
Coinbase’s share price has skyrocketed by an eye-watering 180% this year. With the Q2 quarterly report and the ongoing unsettled with the SEC, the upcoming earnings date is poised to be a major highlight on investors' calendars.
 Source: Bloomberg
Coinbase Q2 Earnings Date:
Coinbase is scheduled to report its second quarter (Q2) earnings after the market closes on the 3rd of August, 2023.
Coinbase Q2 Earnings Expectation:
EPS: $-0.62 (vs $-1.23 in Q2, 2022)
Revenue: $640.41M (vs 865.38M in Q2,2022)
Coinbase Q2 Earnings Key Watch Points
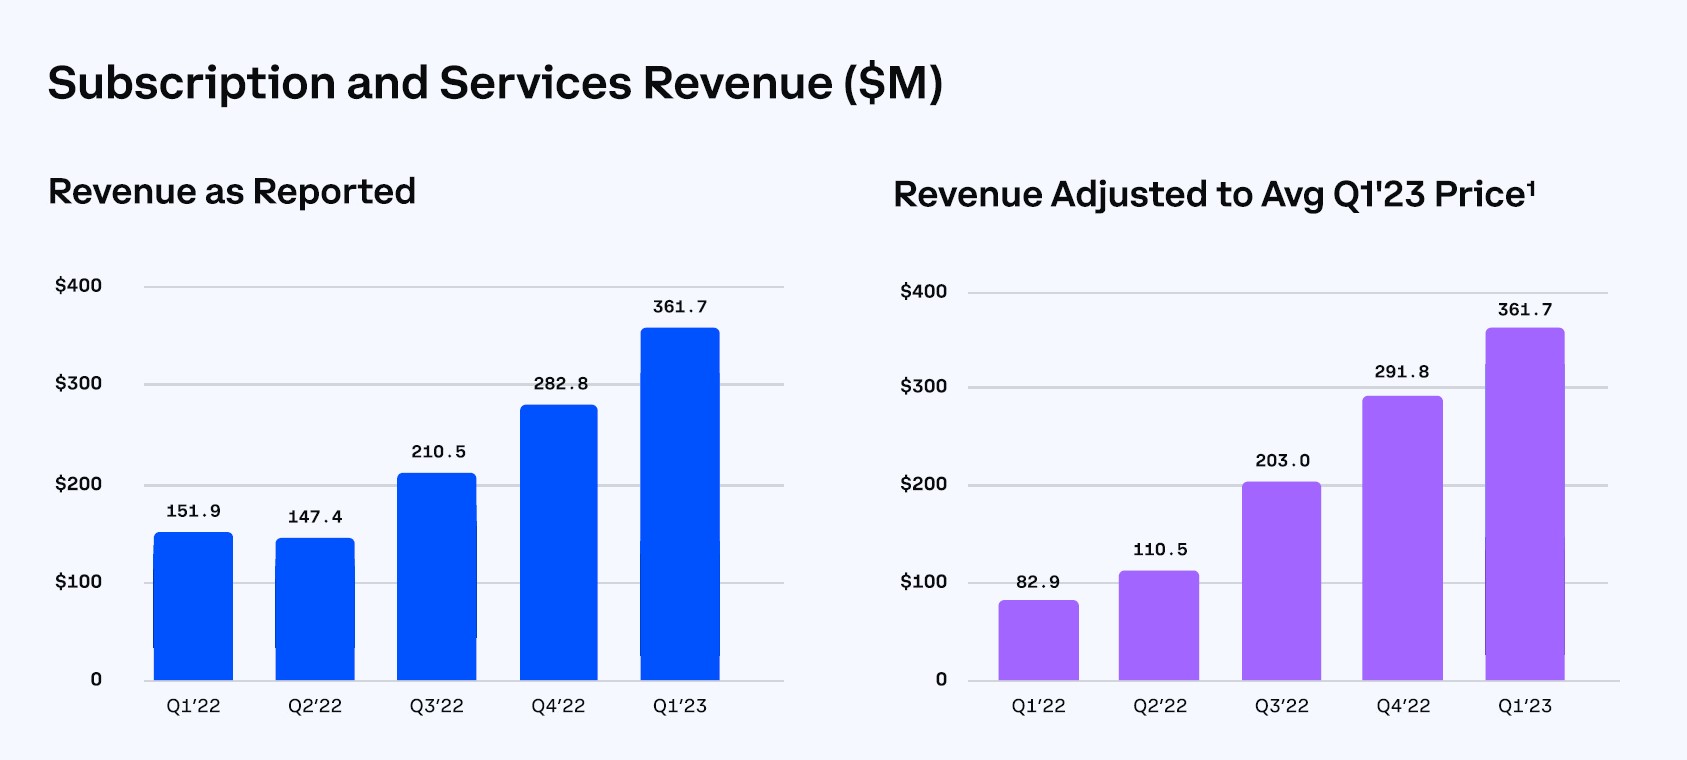
Subscription and Services Revenue:
Based on Coinbase's guideline published with its first-quarter earnings, the trading platform is optimistic that the momentum in its subscription and services revenue will carry over into the second quarter. According to the Q1 results, Coinbase experienced substantial growth in revenue from subscriptions and services, which increased by 16% quarter-over-quarter, reaching $361.7 million. This growth was largely attributed to the rising market capitalization of Crypto assets and increased market volatility during that period.
However, the company is also aware that despite the continued uptrend in market capitalization in the second quarter, the overall market volatility has notably slowed down. In fact, during the first month of the second quarter, the volatility in the Crypto market was 25% lower than the average seen in Q1. As a result, Coinbase expected the Q2’s revenue from subscriptions and services to stay relatively close to the Q1 level, estimating it to be around $300 million.
 Source: Coinbase Q1 earnings report
Cost-efficiency
Early this year, Coinbase anticipated that the company's transaction expenses for the second quarter can be kept in the low and mid-teens, in line with the results from the first quarter, which were at 13%.
However, a sharp increase in sales and marketing expenses is also anticipated. The company projects that the money spent on sales and marketing could increase from $64 million to $80-$90 million, potentially substantially increasing its percent of net revenue. Additionally, the cost of technology development, combined with general administrative expenses, is also expected to increase from $596 million to $600-$650 million.
 Source: Coinbase Q1 earnings report
SEC Lawsuit
In June, the US Securities and Exchange Commission (SEC) filed a lawsuit against Coinbase, accusing the company of operating as an unregistered securities exchange and identified 13 cryptocurrencies traded on the platform as securities. The alleged securities may subject Coinbase to SEC supervision, but the company has opted not to register with the commission. Now, it appears that the company's future heavily depends on the outcome of the court case. Hence, it’s also crucial for the company to restore the shareholders' confidence at this very critical timing.
Coinbase Technical Analysis
From a technical perspective, resurging concerns surrounding the SEC lawsuit have caused the price to pull back from its peak of the year, reaching near $110 in July. Notably, the price has also broken through the mid-term ascending trendline and is currently facing challange at the 20-day MA.
In the near-term, the key support level to watch will be at $90, and a further decline from there could open the floor to its mid-March peak at $83. On the flip side, the 20-day MA at around $94 will continue to be a crucial level for the price to resume its bull-biased momentum before establishing a renewed uptrend.
 Source: IG


0 Comments
Recommended Comments
There are no comments to display.
Create an account or sign in to comment
You need to be a member in order to leave a comment
Create an account
Sign up for a new account in our community. It's easy!
Register a new accountSign in
Already have an account? Sign in here.
Sign In Now