Jump to content

Brent crude oil recovers on China MLF cut while wheat and OJ prices remain under pressure


AshishIG

550 views

Outlook on Brent crude oil, Chicago wheat and orange juice as People’s Bank of China cuts its one-year medium-term lending facility.

original-size.webp
Source: Bloomberg
 
 
 Axel Rudolph FSTA | Senior Financial Analyst, London | Publication date: Tuesday 15 August 2023 14:37

Brent crude oil recovers slightly as top importer China cuts MLF

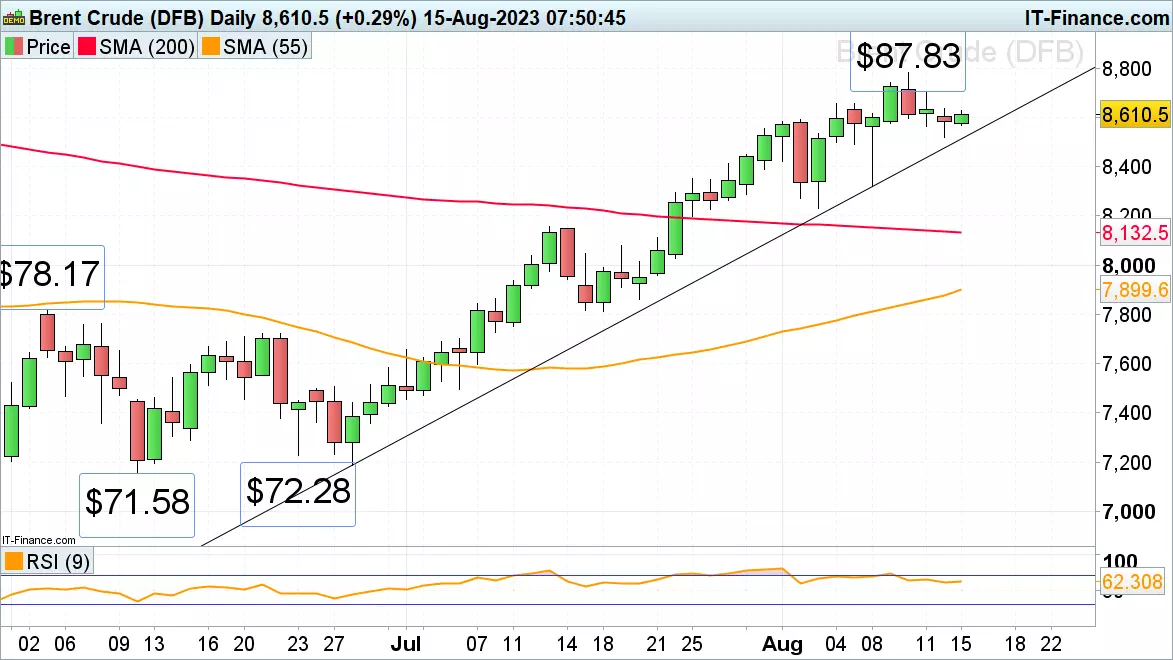
The Brent crude oil price has risen slightly as the People’s Bank of China unexpectedly lowered its one-year medium-term lending facility (MLF) rates by 15 basis points to 2.50% as it seeks to stimulate China’s economy which faces risks from a deepening property crisis and weak consumer spending.

A possible rise above Monday’s high at $86.35 in the Brent crude oil price would probably engage the 4 August high at $86.55. Further up sits last week’s high at $87.83. The June-to-August uptrend line and Monday’s low at $85.19 is expected to offer at least interim support, if revisited. If not, a deeper correction back towards the early August low at $82.31 may be in store.

original-size.webp
Source: ProRealTime

Progressing harvest pushes Chicago Wheat prices to a one-month low

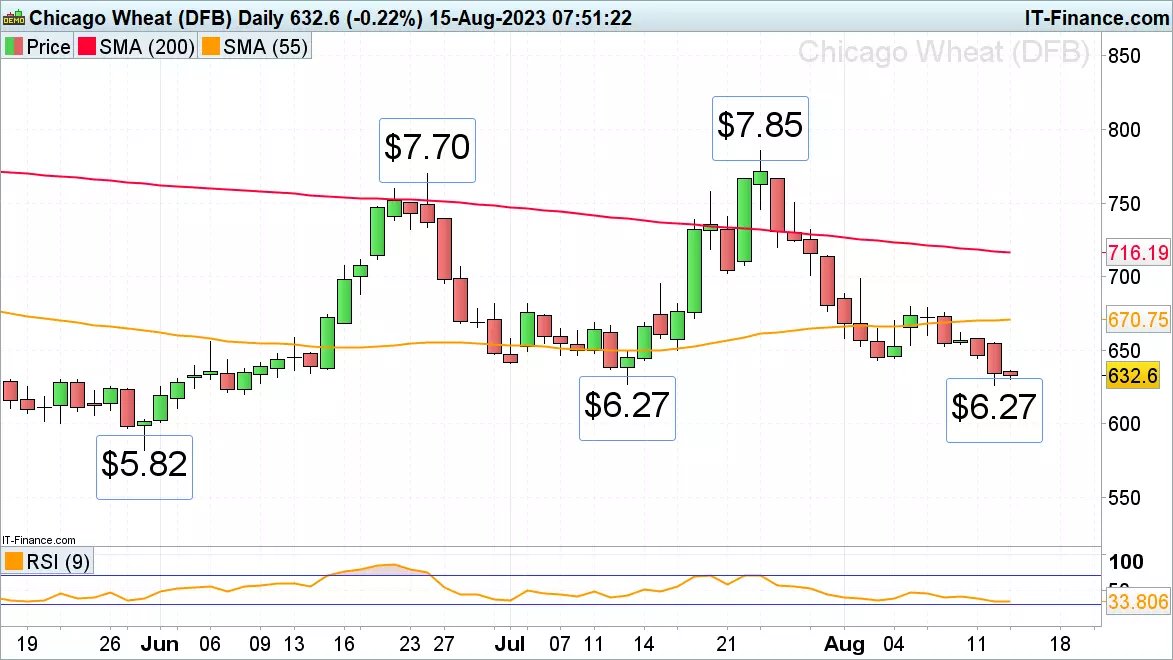
Chicago Wheat’s steady decline from its $7.85 late July high has taken it to a one-month low around $6.27. The drop in the wheat price is supported by US plains rain which continues to improve crop prospects and after the US Department of Agriculture boosted its projection of US wheat ending stocks for 2023-24 to 615 million bus at the end of last week.

A drop through $6.27 on a daily chart closing basis would push the psychological $6 mark back to the fore, below which lurks the May low at $5.82. Minor resistance may be encountered around the $6.43 early August low. From a technical perspective while the price of Chicago Wheat remains below last week’s peak at $6.79, the last few weeks’ downtrend remains intact.

original-size.webp
Source: ProRealTime

Orange juice prices remain capped by the psychological $3 mark

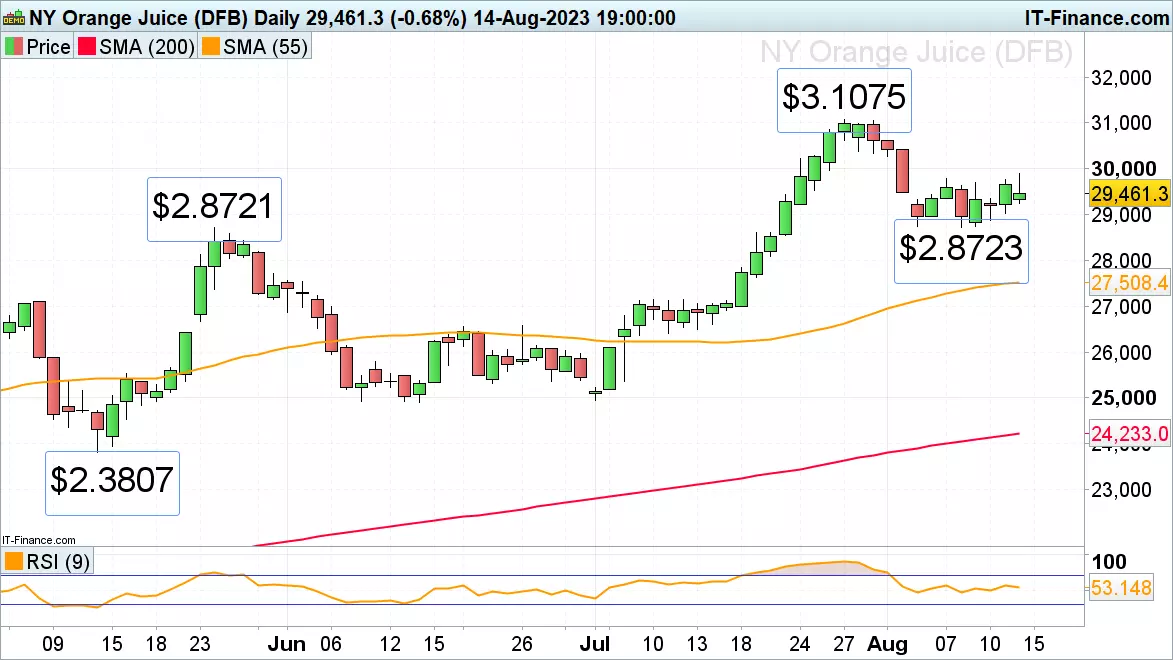
Front month orange juice futures continue to sideways trade below the minor psychological $3.00 mark as they have done since the beginning of August. Monday’s attempt of a break higher seems to have run out of steam at $2.9898. This level and the $3.0000 mark would need to be exceeded for the July high at $3.1075 to come back into play.

While the $3 region continues to cap, the lower end of the August sideways trading range at $2.8723 remains a possible first downside target. Failure there would most likely engage the 55-day simple moving average (SMA) at $2.7508.

original-size.webp
Source: ProRealTime


0 Comments


Recommended Comments

There are no comments to display.

Create an account or sign in to comment

You need to be a member in order to leave a comment

Create an account

Sign up for a new account in our community. It's easy!

Register a new account

Sign in

Already have an account? Sign in here.

Sign In Now
  • Blog Statistics

    • Total Blogs
      3
    • Total Entries
      2,822
  • Latest Forum Topics

  • Our picks

    • International Workers' Day & Early May Trading Hours
      Please be advised that our opening hours will be adjusted on 1 May 2024 for International Workers’ Day and 6 May 2024 for the UK Early May Bank Holiday. Where appropriate, the times listed are in GMT.
        • Like
    • Are these the best AI stocks to watch in May 2024?
      Microsoft, Apple, Nvidia, Amazon and Meta could be the best AI stocks to watch next month. These stocks are the largest AI stocks in the US based on market capitalisation.
    • Natural Gas Commodity Elliottwave Technical Analysis
      Natural Gas


      Mode - Impulsive 


      Structure - Impulse Wave 


      Position - Wave (iii) of 5


      Direction - Wave (iii) of 5 still in play


      Details:  Price now in wave iii as it attempts to breach 1.65 wave i low. Wave (iii) is still expected to extend lower in an impulse.


      Natural Gas is currently breaching the previous April low, marking a decisive move as the impulse initiated on 5th March continues its downward trajectory, further extending the overarching impulse wave sequence that commenced back in August 2022. This decline is anticipated to persist as long as the price remains below the critical resistance level of 2.012.


      Zooming in on the daily chart, we observe the medium-term impulse wave originating from August 2022, which is persisting in its downward trend after completing its 4th wave - delineated as primary wave 4 in blue (circled) - at 3.666 in October 2023. Presently, the 5th wave, identified as primary blue wave 5, is underway, manifesting as an impulse at the intermediate degree in red. It is envisaged that the price will breach the February 2024 low of 1.533 as wave 5 of (3) seeks culmination before an anticipated rebound in wave (4). This confluence of price movements underscores the bearish sentiment prevailing over Natural Gas in the medium term.


      Analyzing the H4 chart, we initiated the impulse wave count for wave (3) from the level of 2.012, which marks the termination point of wave 4. Notably, price action formed a 1-2-1-2 structure, with confirmation established at 1.65 and invalidation set at 2.012. The confirmation of our anticipated direction materialized as price breached the 1.65 mark, signifying a resumption of bearish momentum. Presently, there appears to be minimal resistance hindering the bears, thereby reinstating their dominance in the market. It is projected that wave iii of (iii) of 5 will manifest around 1.43, indicative of the potential for the wave 5 low to extend to 1.3 or even lower. This comprehensive analysis underscores the prevailing bearish outlook for Natural Gas in the immediate future.


      Technical Analyst : Sanmi Adeagbo
       
        • Like
×
×
  • Create New...
us