American Airlines Q3 earnings preview: what to expect amid downgraded projections and market volatility

Entry posted by MongiIG in Market News
493 views
With American Airlines slated to release its Q3 earnings on 19 October, the market braces for impact. From lowered earnings estimates to climbing operational costs and market sentiment, delve into what investors should watch for.
 Source: Bloomberg
When will American Airlines announce its Q3 earnings?
American Airlines Group (NASDAQ:AAL) is scheduled to unveil its quarterly financial results on Thursday, 19 October at 10 pm AEDT, prior to the opening bell of the stock market.
What does 'The Street' expect from American Airlines' Q3 earnings?
After a bullish Q2 outlook, American Airlines has dramatically scaled back its Q3 earnings per share projections from an initial range of $0.85 to $0.95 to a revised estimate of just $0.20 to $0.30.
According to a consensus from analysts and brokers polled by Refinitiv as of October 16, 2023, the forthcoming Q3 results are anticipated to be:
- Revenue: $13.515 billion, marking a modest 0.39% YoY increase
- Earnings Per Share: $0.25, representing a significant 63.47% YoY decline
The airline has faced operational headwinds that have led to this downgrade in earnings forecasts. Key contributing factors include escalating fuel and labour expenses, coupled with muted demand. Notably, the company incurred a $230 million cost in August, settling with the Airline Pilots Association.
 Source: Bloomberg
What should you know?
- American Airlines is set to unveil its quarterly earnings on October 19, amid a climate of reduced expectations for Q3 performance
- Both the company and financial analysts have lowered their forecasts for the quarter, attributing the downgrade to a combination of escalating fuel and labor expenses, as well as revised, softer demand projections
- Despite holding a 'neutral' broker rating, American Airlines' shares are trading below the company's long-term average price target
- Currently in oversold territory, the share price of American Airlines Group faces bearish prospects in the short to medium term.
Q3 2023 financial forecast overview
Netflix Inc. has recently provided insight into its financial forecast for the third quarter of 2023. As a prominent player in the entertainment sector, key financial metrics for the company include revenue growth and operating margin, which serves as a measure of profitability.
The company aims to accelerate revenue growth, expand operating margins, and generate increasing positive free cash flow. The market is likely to evaluate the forthcoming results against these metrics, as well as subscriber growth.
Confidence boost: the role of paid sharing
The company has conveyed heightened confidence in its financial outlook, owing to the successful roll-out of paid sharing. This initiative is projected to spur revenue growth in the latter half of 2023 as it is extended to nearly all remaining countries and continues to bolster the company's ad-supported plan.
Q3 2023 financial forecast
For Q3, the forecast indicates an expected revenue of $8.5 billion, marking a year-on-year increase of 7% on both a reported and currency-neutral basis. This represents a minor acceleration from Q2 2023's currency-neutral revenue growth rate of 6%. The revenue upswing in Q3 is anticipated to be propelled by an increase in average paid memberships.
Challenges: ARPU and price increases
However, the currency-neutral Average Revenue Per User (ARPU) is forecasted to remain flat or experience a slight dip year-on-year. This is attributed to the lapping of price hikes implemented in 2022 and the absence of price increases in the company's largest revenue markets since the first half of 2022. Earnings from advertising and additional member features are not yet substantial enough to counterbalance these elements.
Subscriber growth: Q3 vs. Q2
In terms of subscriber growth, Q3 2023 paid net additions are expected to align with Q2 2023 figures. The company anticipates a more significant acceleration in revenue growth during Q4 2023, driven by further monetisation of account sharing between households and a steady increase in advertising revenue.
Profitability: looking beyond revenue
On the profitability front, Netflix projects a Q3 operating income of $1.9 billion, up from $1.5 billion in Q3 2022, and an operating margin of 22%, an increase from 19% in the corresponding period last year. For the full year of 2023, the company is targeting an operating margin of between 18% and 20%, based on forex rates as of 1 January 2023, marking an uptick from 17.8% in FY 2022.
Strategic outlook: future growth strategies
Netflix is concentrated on fuelling growth and enhancing profitability through leveraged strategies such as paid sharing and advertising.
How to trade the American Airlines Q3 2023 results
Based on IG's TipRanks Smart Score, American Airlines Group is rated as a 'Hold,' featuring a long-term average price target of $16.17 per share as of October 16, 2023. While public sentiment leans bullish, it's noteworthy that hedge funds have been net sellers of the stock in the past quarter.
American Airlines smart score chart
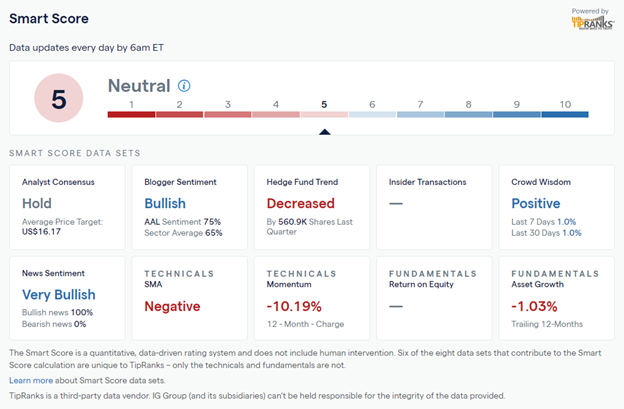 Source: IG TipRanks
American Airlines echnical analysis
From a technical analysis standpoint, the momentum for the short-to-medium term trend is currently bearish, with the stock price testing the critical support level at 11.85. Should the price close below this level, the next downside target would be 10.95. In such a scenario, traders considering a short position might look at a close above 12.85 as a key stop-loss point.
The 10.95 mark becomes pivotal if tested, given the lack of substantial historical support until reaching the 9.05 level.
For those traders inclined toward a long position, a bounce back from the current oversold status and a closing price above the 12.85 resistance level would be the indicators for potentially establishing new long positions.
American Airlines daily chart
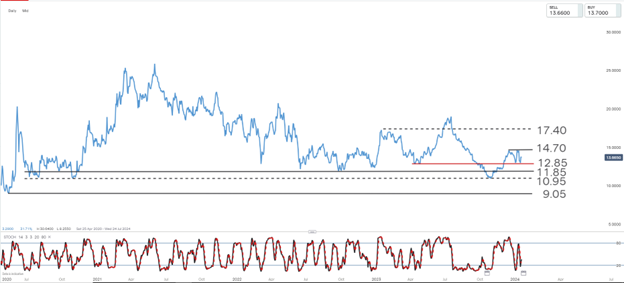 Source: IG
This information has been prepared by IG, a trading name of IG Australia Pty Ltd. In addition to the disclaimer below, the material on this page does not contain a record of our trading prices, or an offer of, or solicitation for, a transaction in any financial instrument. IG accepts no responsibility for any use that may be made of these comments and for any consequences that result. No representation or warranty is given as to the accuracy or completeness of this information. Consequently any person acting on it does so entirely at their own risk. Any research provided does not have regard to the specific investment objectives, financial situation and needs of any specific person who may receive it. It has not been prepared in accordance with legal requirements designed to promote the independence of investment research and as such is considered to be a marketing communication. Although we are not specifically constrained from dealing ahead of our recommendations we do not seek to take advantage of them before they are provided to our clients.


0 Comments
Recommended Comments
There are no comments to display.
Create an account or sign in to comment
You need to be a member in order to leave a comment
Create an account
Sign up for a new account in our community. It's easy!
Register a new accountSign in
Already have an account? Sign in here.
Sign In Now