FTSE soars to yearly peak as BoE's dovish turn fuels market optimism

Entry posted by MongiIG in Market News
524 views
FTSE hits a 12-month high after the Bank of England's dovish pivot sparks rate cut expectations, shifting focus to German consumer confidence data.
 Source: Bloomberg
Last week, the FTSE reached a 12-month peak, breaking free from its long-standing range following a dovish surprise at the Bank of England (BoE) meeting.
While the BoE kept rates on hold at 5.25% as widely expected, a dovish pivot was provided as two BoE members, Mann and Haskel, who had voted for hikes in February, removed their hawkish dissent.
The dovish pivot implies the bar to BoE rate cuts is much lower than previously thought and has resulted in the interest rate market pulling forward, the expected timing of the BoE's first rate cut to June (17 of 25bp priced) from August. There is currently a total of 72 bp of cuts priced for 2024, up from 66 pre-last week's BoE meeting.
With a light data calendar this week in the UK and Europe, the focus will be on the release of German consumer confidence data this evening.
What is expected from the GFK Consumer Confidence survey (Tuesday, 26 March at 6pm)
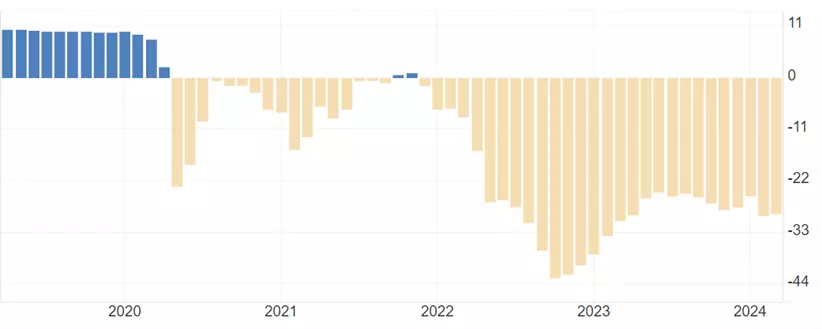
Heading into March, German Consumer Confidence increased to -29 from an eleven-month low of -29.6. Expectations of ECB rate cuts are starting to filter through into some business sentiment surveys, such as the ZEW, which recently jumped to its highest level in two years.
This impact, along with slowing inflation and rising household incomes, should also be observed in upcoming consumer confidence surveys. However as can be viewed on the chart below, a good deal of improvement is required before consumer confidence returns to positive territory.
GFK consumer confidence chart
 Source: TradingEconomics
FTSE technical analysis
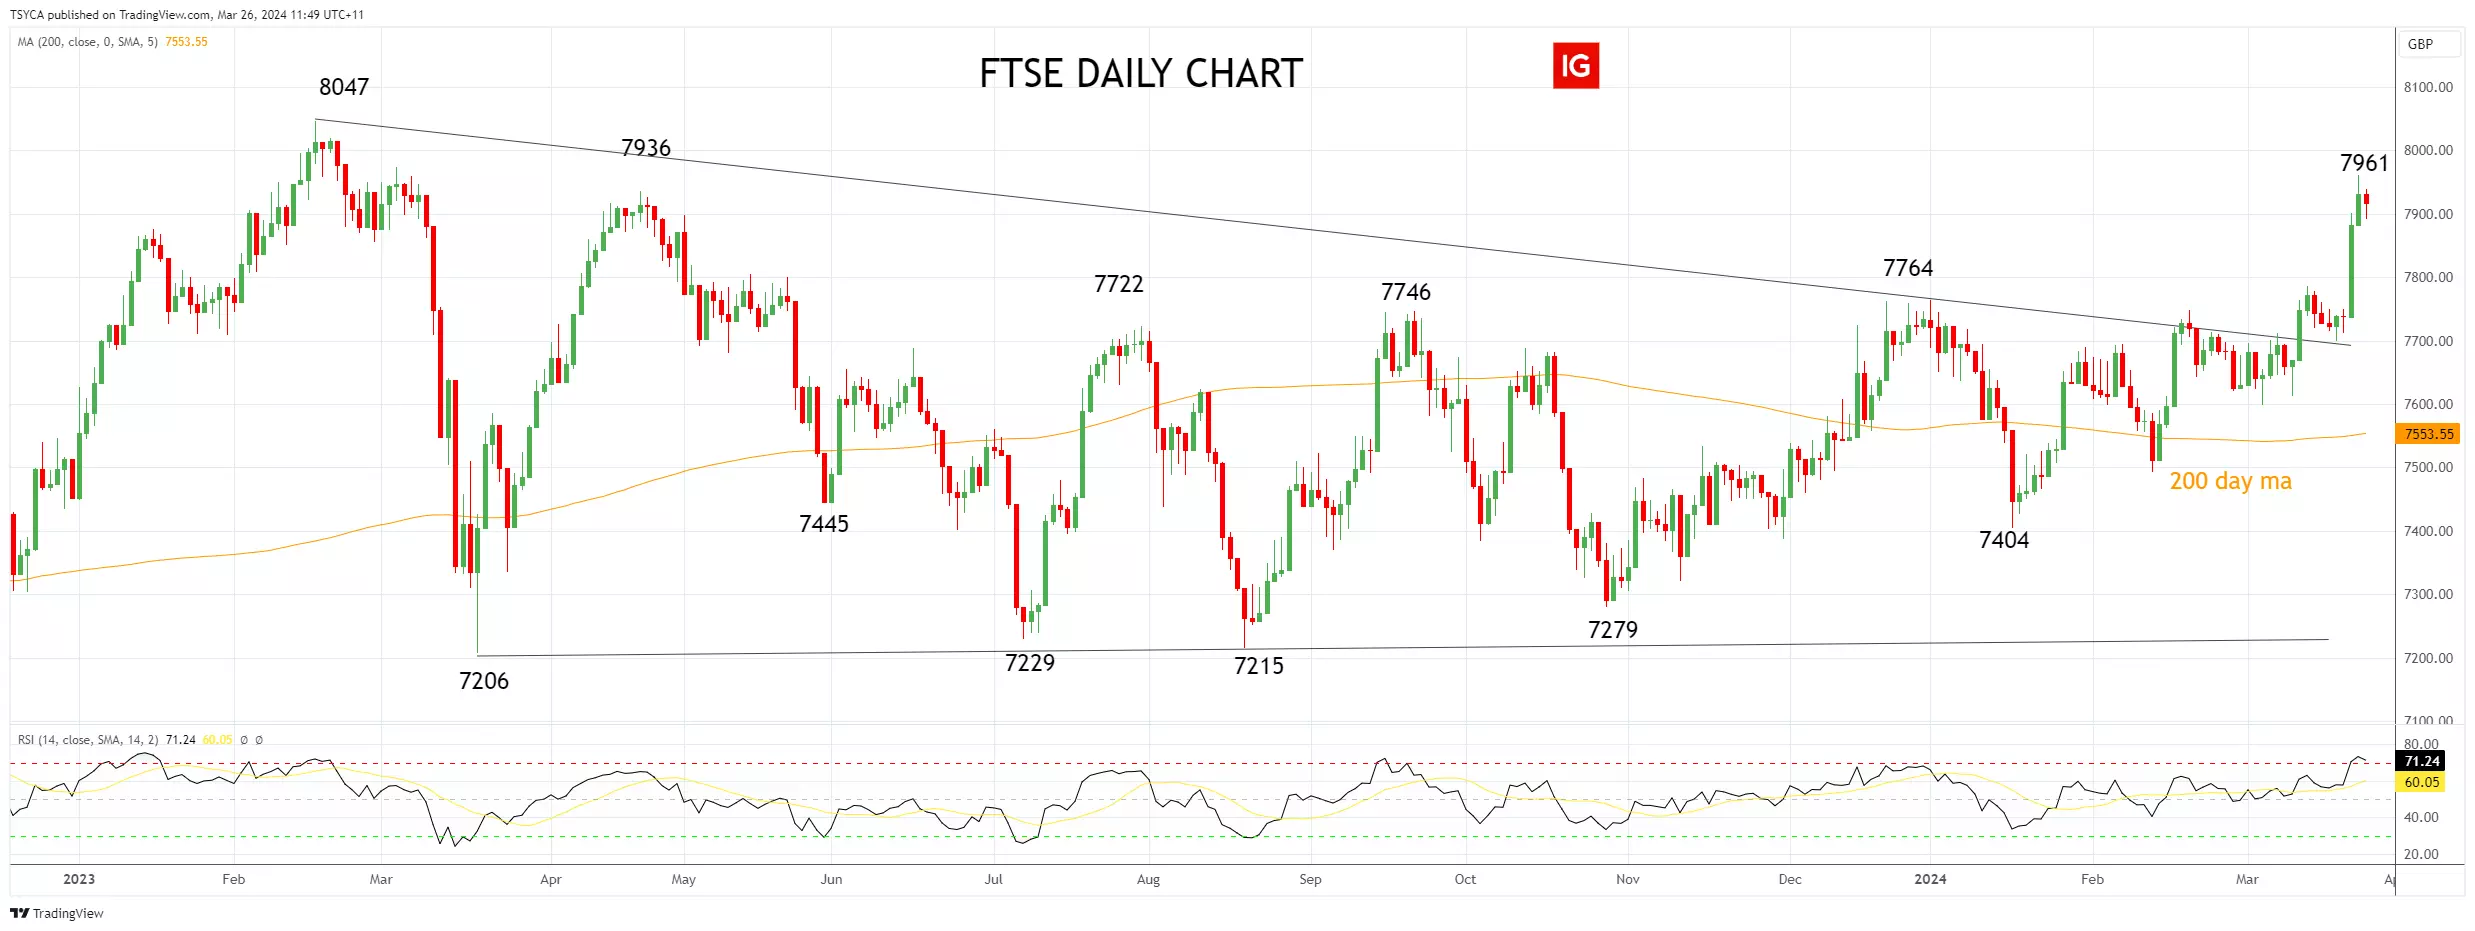
After many weeks of discussing the potential for the FTSE to break higher, it finally hit the after-burners last week, surging 2.63% to a 12-month high of 7961.
From here, we expect dip buyers to be active ahead of support, formerly resistance, in the 7760/20 area. We are looking for the FTSE to test and break its all-time high of 8047 before a push towards 8250.
Aware that if the FTSE were to lose support at 7760/20 on a sustained basis, it would warn that the break higher has failed and likely see a retest of the 200-day moving average at 7550.
FTSE daily chart
 Source: TradingView
DAX technical analysis
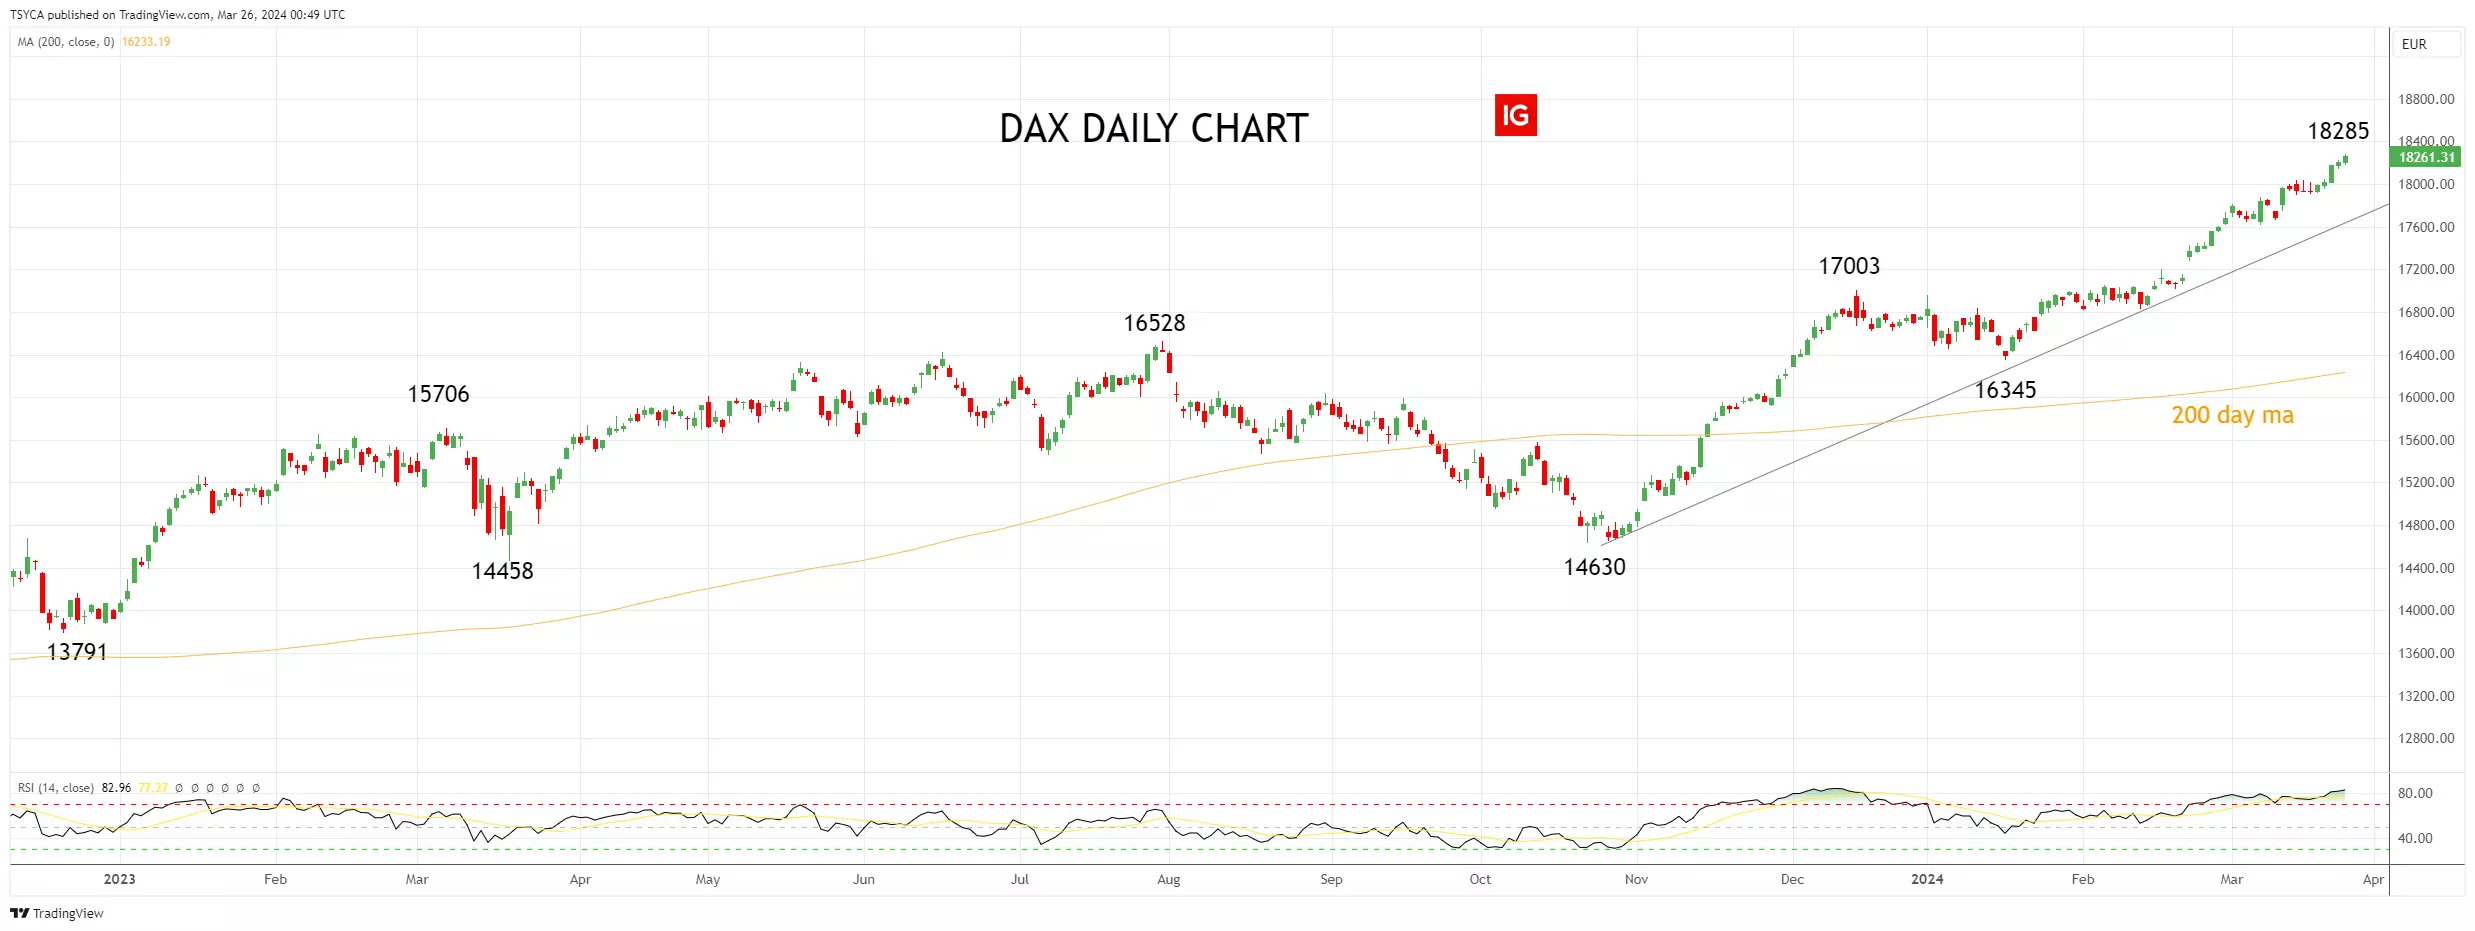
The DAX has had a memorable month, gaining 4.85% in March. This makes it a candidate for some month-end/quarter-end rebalancing selling flows this week. While there are many moving parts to rebalancing, typically, it involves selling the best-performing stock markets, which for March would be Korea, Germany, Japan, and the US, and buying the laggards.
Weakness should be well supported initially at 18,000/17,900. However, the more important area of support is at 17,650, coming from the October 14,630 low. Providing this level holds, the uptrend remains intact and with-it expectations of a push towards 18,500.
DAX daily chart
 Source: TradingView
- Source: TradingView. The figures stated are as of 26 March 2024. Past performance is not a reliable indicator of future performance. This report does not contain and is not to be taken as containing any financial product advice or financial product recommendation.
This information has been prepared by IG, a trading name of IG Australia Pty Ltd. In addition to the disclaimer below, the material on this page does not contain a record of our trading prices, or an offer of, or solicitation for, a transaction in any financial instrument. IG accepts no responsibility for any use that may be made of these comments and for any consequences that result. No representation or warranty is given as to the accuracy or completeness of this information. Consequently any person acting on it does so entirely at their own risk. Any research provided does not have regard to the specific investment objectives, financial situation and needs of any specific person who may receive it. It has not been prepared in accordance with legal requirements designed to promote the independence of investment research and as such is considered to be a marketing communication. Although we are not specifically constrained from dealing ahead of our recommendations we do not seek to take advantage of them before they are provided to our clients.


0 Comments
Recommended Comments
There are no comments to display.
Create an account or sign in to comment
You need to be a member in order to leave a comment
Create an account
Sign up for a new account in our community. It's easy!
Register a new accountSign in
Already have an account? Sign in here.
Sign In Now