S&P 500, Nasdaq: Holiday-shortened week to leave US inflation data on watch

Entry posted by MongiIG in Market News
602 views
The holiday-shortened week may see a lighter front on the economic calendar, but nevertheless, eyes will be on a key US inflation data release this week, the US core PCE price index, to lay the path for the Fed’s rate outlook.
 Source: Bloomberg
Holiday-shortened week to leave US inflation data on watch
The holiday-shortened week may see a lighter front on the economic calendar, but nevertheless, eyes will be on a key US inflation data release this week, the US core Personal Consumption Expenditures (PCE) price index, to lay the path for the Federal Reserve (Fed)’s rate outlook. Major US indices have been broadly taking a breather into the new week – perhaps an expected reaction to the lack of major data, but with traction still found in selected stocks on earning releases. Nonetheless, Wall Street has been remarkably resilient this year, shrugging off the usual weaker seasonality for March and the stronger US dollar to hover around fresh record highs.
What to watch: US core PCE price index
At the recent Fed meeting, policymakers have revealed some tolerance for slightly higher inflation, with Fed Chair Jerome Powell noting that higher inflation data lately has not changed its overall trend downward and that the path of inflation towards its 2% target will be a “bumpy road”.
As such, further easing in pricing pressures ahead will provide validation for the Fed’s decision to stick to its path of three rate cuts through 2024. The US core PCE price index, which is the Fed’s preferred inflation gauge, is expected to stay unchanged at 2.8% year-on-year. However, month-on-month, it is expected to tick lower to 0.3% from the previous 0.4% in January. On the other hand, the headline PCE price index is expected to tick slightly higher to 2.5% from a year ago, up from the previous 2.4%.
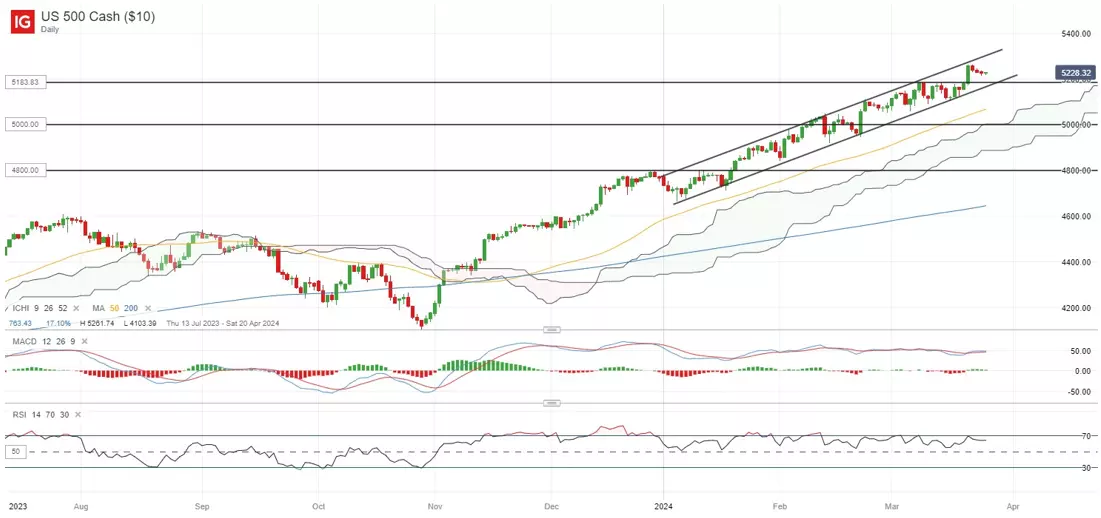
S&P 500 technical analysis: Upward trend resumes
The S&P 500 continues to trade within a rising channel pattern, with the formation of new higher high and higher lows validating the prevailing upward trend. For now, it seems that the bullish bias will remain, unless the lower channel trendline support gives way to prompt a deeper retracement. Its daily relative strength index (RSI) has also been trading above the key 50 level for the fourth straight month, reflecting buyers in control. On the daily chart, the index has been trading above its Ichimoku Cloud as well, alongside various moving averages (MAs) (50-day, 100-day, 200-day). The only catch is that divergences have occurred at the daily RSI (lower highs on index’s peaks), but the divergence has been playing out since the start of the year and buyers have been taking any opportunities for weakness to buy any dip.
 Source: IG charts
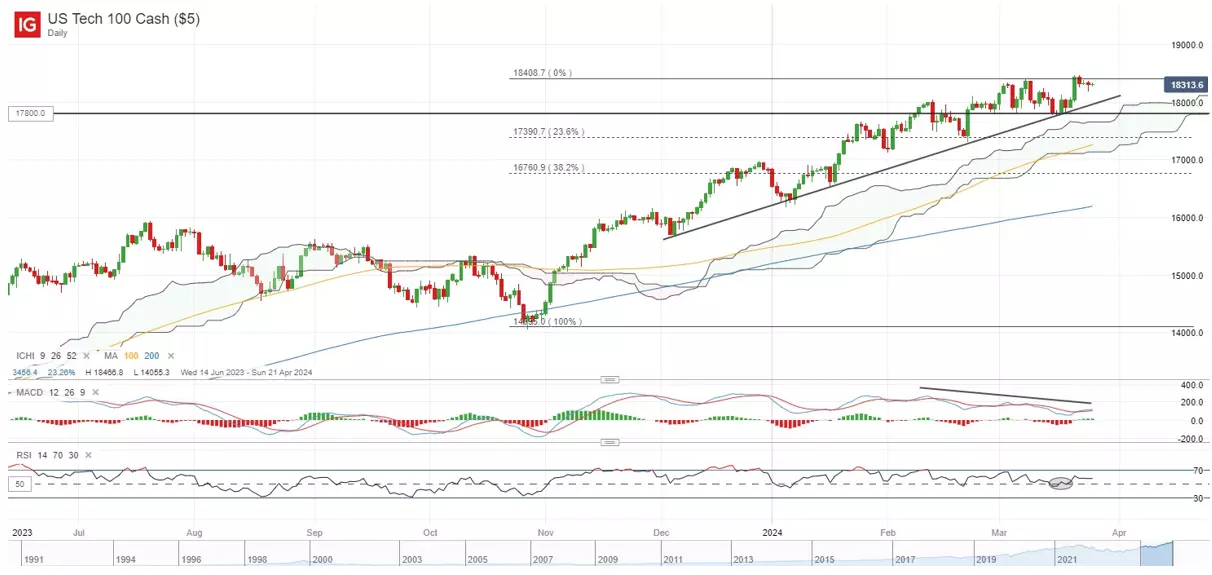
Nasdaq 100 technical analysis: Another touch of record high territory
The Nasdaq 100 index has gained some ground after the recent Fed meeting, tapping on the weaker US Treasury yields and continued traction around the artificial intelligence (AI) hype to touch a new record high at around the 18,457 level. Its daily RSI has also been trading above the 50 level since November last year, with buyers successfully defending the key level in mid-March to keep the near-term upward bias intact. Ahead, a continuation of its prevailing upward trend may leave the 19,000 level on watch next, while on the downside, an upward trendline may be immediate support to hold around the 17,800-18,000 level.
 Source: IG charts
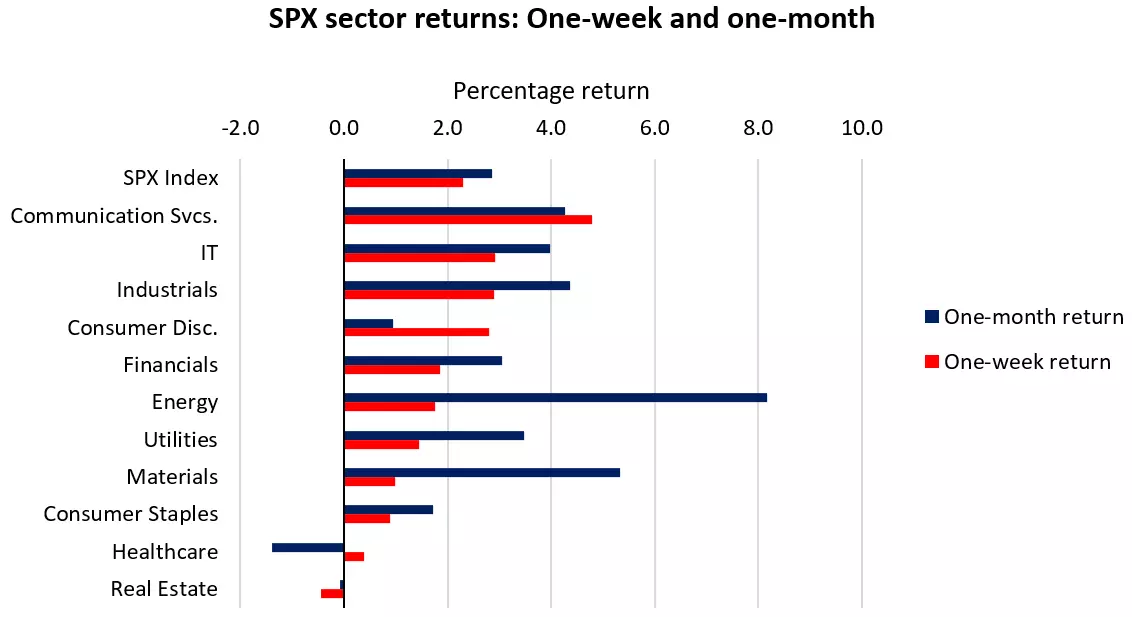
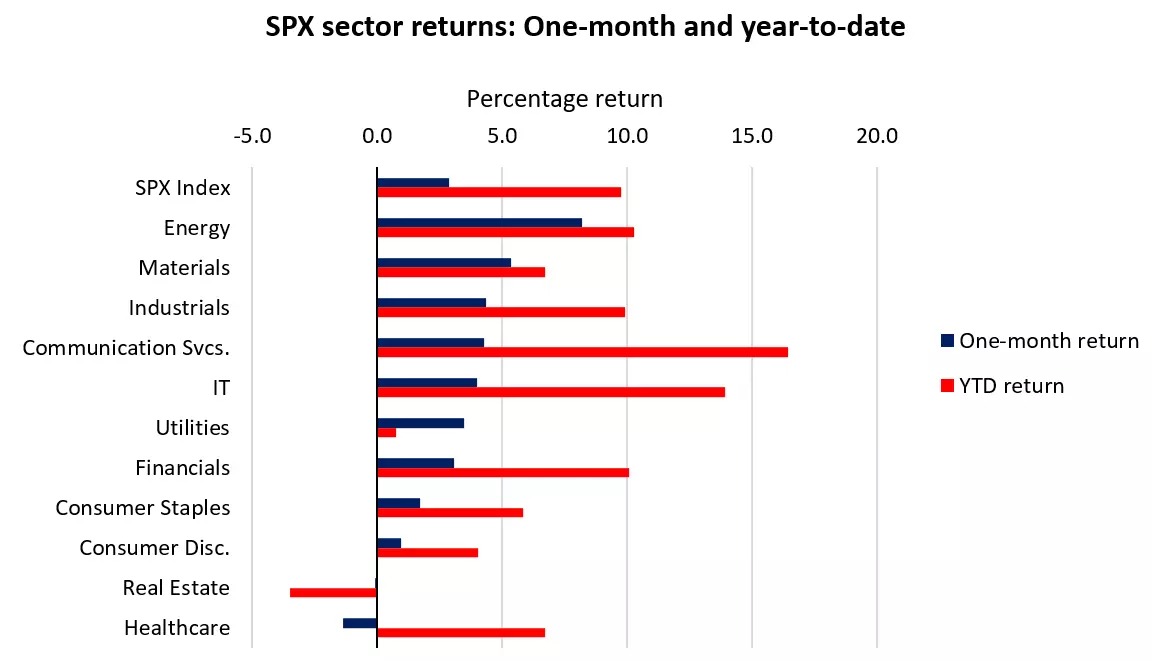
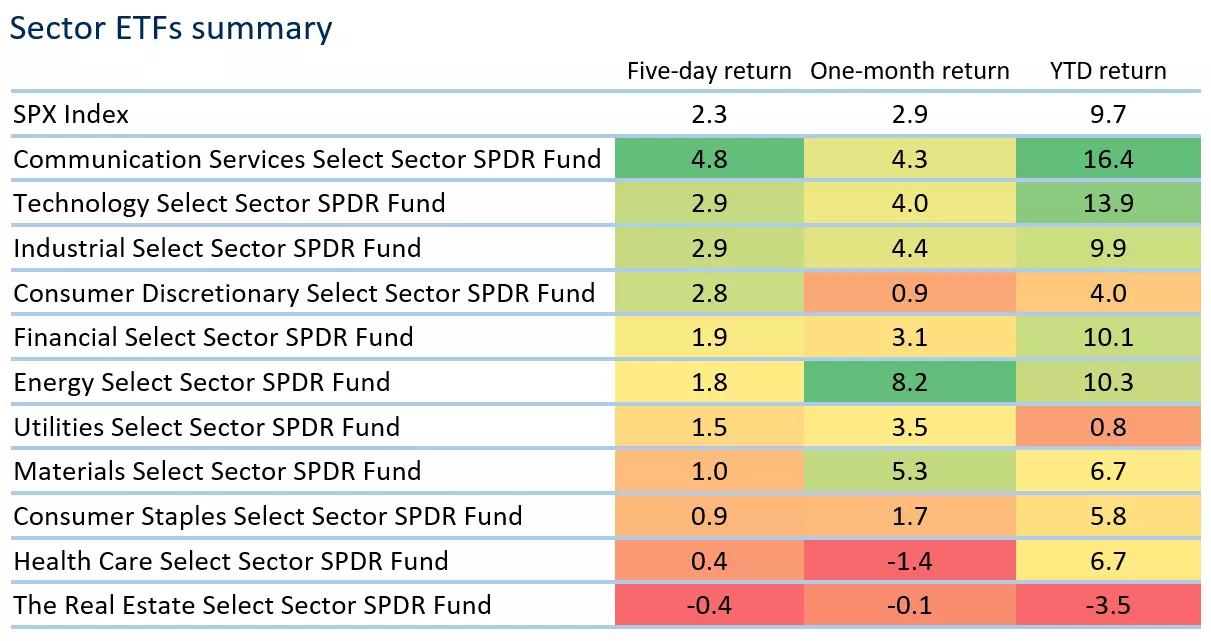
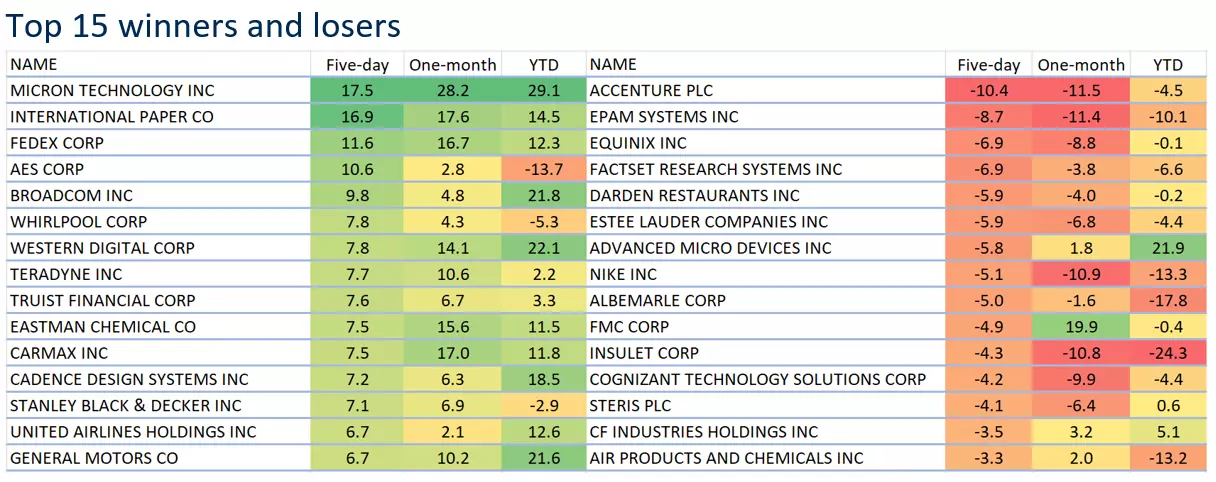
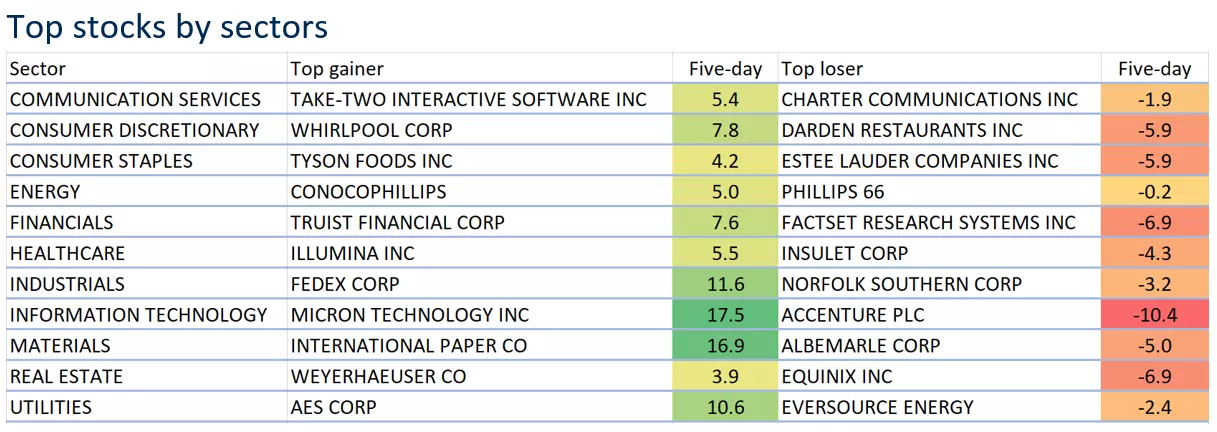
Sector performance
Sector performance last week revealed outperformance in rate-sensitive growth sectors, as market participants took comfort in the view that the Fed is willing to tolerate some inflation persistence and continue to look forward to impending rate cuts over the coming months. The communication services sector was up 4.8%, with strength in Alphabet (+1.8%) and Meta (+1.2%), while the technology sector was once again heavy-lifted by Nvidia (+7.4%). Notably, in the semiconductor space, Micron surged 24.9% for the week, Broadcom was up 9.2% but AMD was dragged 6.3% lower. Other “Magnificent Seven” stocks were more mixed, with Apple (-1.7%) in the red while Microsoft (+1.3%) and Amazon (+3.0%) offered support. It has broadly been another week of risk-taking, with ten out of 11 S&P 500 sectors seeing gains, while defensives sector (consumer staples, healthcare) saw less traction from market participants.
 Source: Refinitiv
 Source: Refinitiv
 Source: Refinitiv *Note: The data is from 19th – 25th March 2024.
 Source: Refinitiv *Note: The data is from 19th – 25th March 2024.
 Source: Refinitiv *Note: The data is from 19th – 25th March 2024.
This information has been prepared by IG, a trading name of IG Markets Limited. In addition to the disclaimer below, the material on this page does not contain a record of our trading prices, or an offer of, or solicitation for, a transaction in any financial instrument. IG accepts no responsibility for any use that may be made of these comments and for any consequences that result. No representation or warranty is given as to the accuracy or completeness of this information. Consequently any person acting on it does so entirely at their own risk. Any research provided does not have regard to the specific investment objectives, financial situation and needs of any specific person who may receive it. It has not been prepared in accordance with legal requirements designed to promote the independence of investment research and as such is considered to be a marketing communication. Although we are not specifically constrained from dealing ahead of our recommendations we do not seek to take advantage of them before they are provided to our clients. See full non-independent research disclaimer and quarterly summary.


1 Comment
Recommended Comments
Create an account or sign in to comment
You need to be a member in order to leave a comment
Create an account
Sign up for a new account in our community. It's easy!
Register a new accountSign in
Already have an account? Sign in here.
Sign In Now