Jump to content

Oil Down, Sigh of Relief as OPEC+ Reaches Supply Agreement

MongiIG

1,552 views

OPEC+ Clinches Deal to Boost Output as Gulf Allies Call Truce


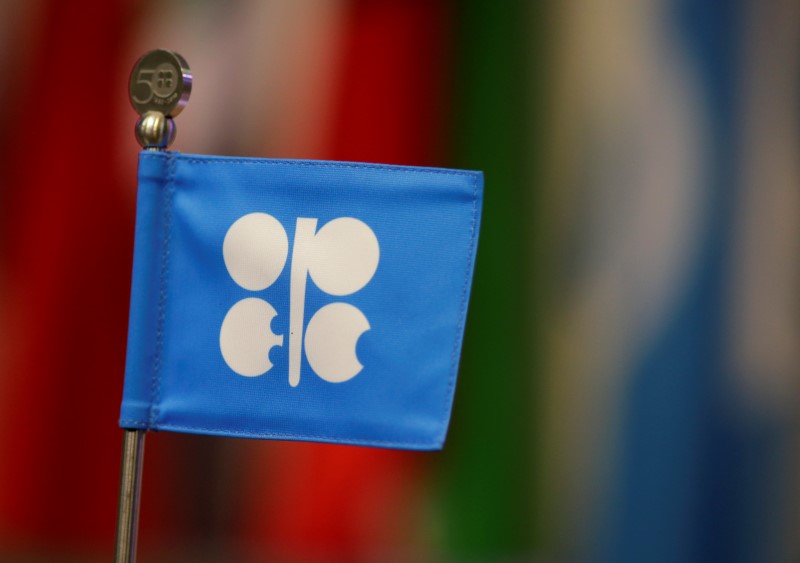
Oil was down Monday morning in Asia, with prices falling more than 1%. Investors continued to digest the Organization of the Petroleum Exporting Countries and allies (OPEC+) agreement to boost output that was reached over the weekend.

Brent oil futures fell 1.16% to $72.74 by 11:41 PM ET (3:41 AM GMT) after falling nearly 3% during the previous week. WTI futures slid 1.17% to $70.72, after rolling over to the Sep. 21 contract on Jul. 18.

Under the agreement reached on Sunday, the cartel will add 400,000 barrels a day every month from August 2021 onwards until all the output that was halted due to COVID-19 is revived. The agreement also gives Saudi Arabia, the United Arab Emirates (UAE), Iraq, Kuwait and Russia higher baselines against which their output cuts are measured starting in May 2022.

Investors breathed a sigh of relief as the dispute between Saudi Arabia and the UAE that saw the last OPEC+ meeting end without an agreement was resolved. Additionally, other longstanding grievances that threatened the cartel’s unity were also resolved.

"This agreement should give market participants comfort that the group is not headed for a messy breakup and will not be opening up the production floodgates anytime soon," RBC Capital Markets said in a note.

The market also avoided a price war not unlike the one between Saudi Arabia and Russia that saw the black liquid enter negative territory in April 2020.

On the supply side, Iran’s first crude export from outside the Persian Gulf and beyond the Strait of Hormuz is also on investors’ radars. The shipment will leave from Jask in the Gulf of Oman, said Vahid Maleki, director of the Jask Oil Terminal.

Meanwhile, COVID-19 cases involving the Delta variant continue to increase and cloud the fuel demand outlook as some countries, including Australia and South Korea, reintroduced restrictive measures to curb their latest outbreaks. The U.K. on Saturday reported the highest number of daily COVID-19 cases since January 2021 ahead of England lifting of most restrictive measures on Jul. 19.


By Gina Lee, 19th July 2021. Investing.com

0 Comments


Recommended Comments

There are no comments to display.

Create an account or sign in to comment

You need to be a member in order to leave a comment

Create an account

Sign up for a new account in our community. It's easy!

Register a new account

Sign in

Already have an account? Sign in here.

Sign In Now
  • Blog Statistics

    • Total Blogs
      3
    • Total Entries
      2,822
  • Latest Forum Topics

  • Our picks

    • International Workers' Day & Early May Trading Hours
      Please be advised that our opening hours will be adjusted on 1 May 2024 for International Workers’ Day and 6 May 2024 for the UK Early May Bank Holiday. Where appropriate, the times listed are in GMT.
        • Like
    • Are these the best AI stocks to watch in May 2024?
      Microsoft, Apple, Nvidia, Amazon and Meta could be the best AI stocks to watch next month. These stocks are the largest AI stocks in the US based on market capitalisation.
    • Natural Gas Commodity Elliottwave Technical Analysis
      Natural Gas


      Mode - Impulsive 


      Structure - Impulse Wave 


      Position - Wave (iii) of 5


      Direction - Wave (iii) of 5 still in play


      Details:  Price now in wave iii as it attempts to breach 1.65 wave i low. Wave (iii) is still expected to extend lower in an impulse.


      Natural Gas is currently breaching the previous April low, marking a decisive move as the impulse initiated on 5th March continues its downward trajectory, further extending the overarching impulse wave sequence that commenced back in August 2022. This decline is anticipated to persist as long as the price remains below the critical resistance level of 2.012.


      Zooming in on the daily chart, we observe the medium-term impulse wave originating from August 2022, which is persisting in its downward trend after completing its 4th wave - delineated as primary wave 4 in blue (circled) - at 3.666 in October 2023. Presently, the 5th wave, identified as primary blue wave 5, is underway, manifesting as an impulse at the intermediate degree in red. It is envisaged that the price will breach the February 2024 low of 1.533 as wave 5 of (3) seeks culmination before an anticipated rebound in wave (4). This confluence of price movements underscores the bearish sentiment prevailing over Natural Gas in the medium term.


      Analyzing the H4 chart, we initiated the impulse wave count for wave (3) from the level of 2.012, which marks the termination point of wave 4. Notably, price action formed a 1-2-1-2 structure, with confirmation established at 1.65 and invalidation set at 2.012. The confirmation of our anticipated direction materialized as price breached the 1.65 mark, signifying a resumption of bearish momentum. Presently, there appears to be minimal resistance hindering the bears, thereby reinstating their dominance in the market. It is projected that wave iii of (iii) of 5 will manifest around 1.43, indicative of the potential for the wave 5 low to extend to 1.3 or even lower. This comprehensive analysis underscores the prevailing bearish outlook for Natural Gas in the immediate future.


      Technical Analyst : Sanmi Adeagbo
       
        • Like
×
×
  • Create New...
us