Nasdaq 100 Outlook: Strong Intel Earnings May Lead Stocks Higher

Entry posted by ArvinIG in Analyst Article
520 views
NASDAQ 100, TREASURY YIELDS, INTEL EARNINGS, DOW JONES - TALKING POINTS
- Nasdaq 100 leads markets higher as Treasury yields decline following disappointing jobs data
- Intel reports Q2 Earnings, Revenues & EPS beat estimates, full year guidance raised
- Nasdaq 100 gearing up for another test of 15,000 following constructive price action, earnings
US equity benchmarks continued their march higher on Thursday, led by the Nasdaq 100. Tech shares bounced on declines in US Treasury yields, which came following a disappointing and unexpected jump in unemployment claims. Market participants appear to be positioning into tech-related equities prior to next week, which will see some of the largest tech firms report their quarterly earnings. The Dow Jones posted its third consecutive day of gains, while the S&P 500 also notched slight gains.
NASDAQ 100 1 HOUR CHART

Chart provided by TradingView
Intel reported earnings for Q2, with many following along for guidance as it relates to the global semiconductor shortage. Intel posted a strong quarter, beating revenue and earnings estimates. Q2 EPS came in at $1.28 per share, vs. estimates of $1.07. Revenues totaled $18.5 billion, against a consensus estimate of $17.8 billion. The world’s largest chipmaker also raised 2021 guidance, indicating that there may be light at the end of the tunnel for chipmakers and those reliant on their chips. Despite the strong quarter, shares of Intel dipped slightly in immediate after-hours trading.
Broader markets have rebounded well this week following concerns over the Delta variant of COVID. The largest and most significant Nasdaq 100 constituents begin to report earnings next week, which may explain this week’s bullish price action. The question remains whether strong earnings will be enough to propel markets higher, with the tech-heavy index having already tested the 15,000 level. The S&P 500 slipped on Monday, tagging its 50-day moving average. The bounce following Monday’s decline sees the index retest an ascending trendline from November 2020, which may act as near-term resistance. “Under the surface” rotation may help prevent a broader sell-off, but future retracements back to the 50-day MA may persist given 2021’s price action.
S&P 500 (SPX) DAILY CHART
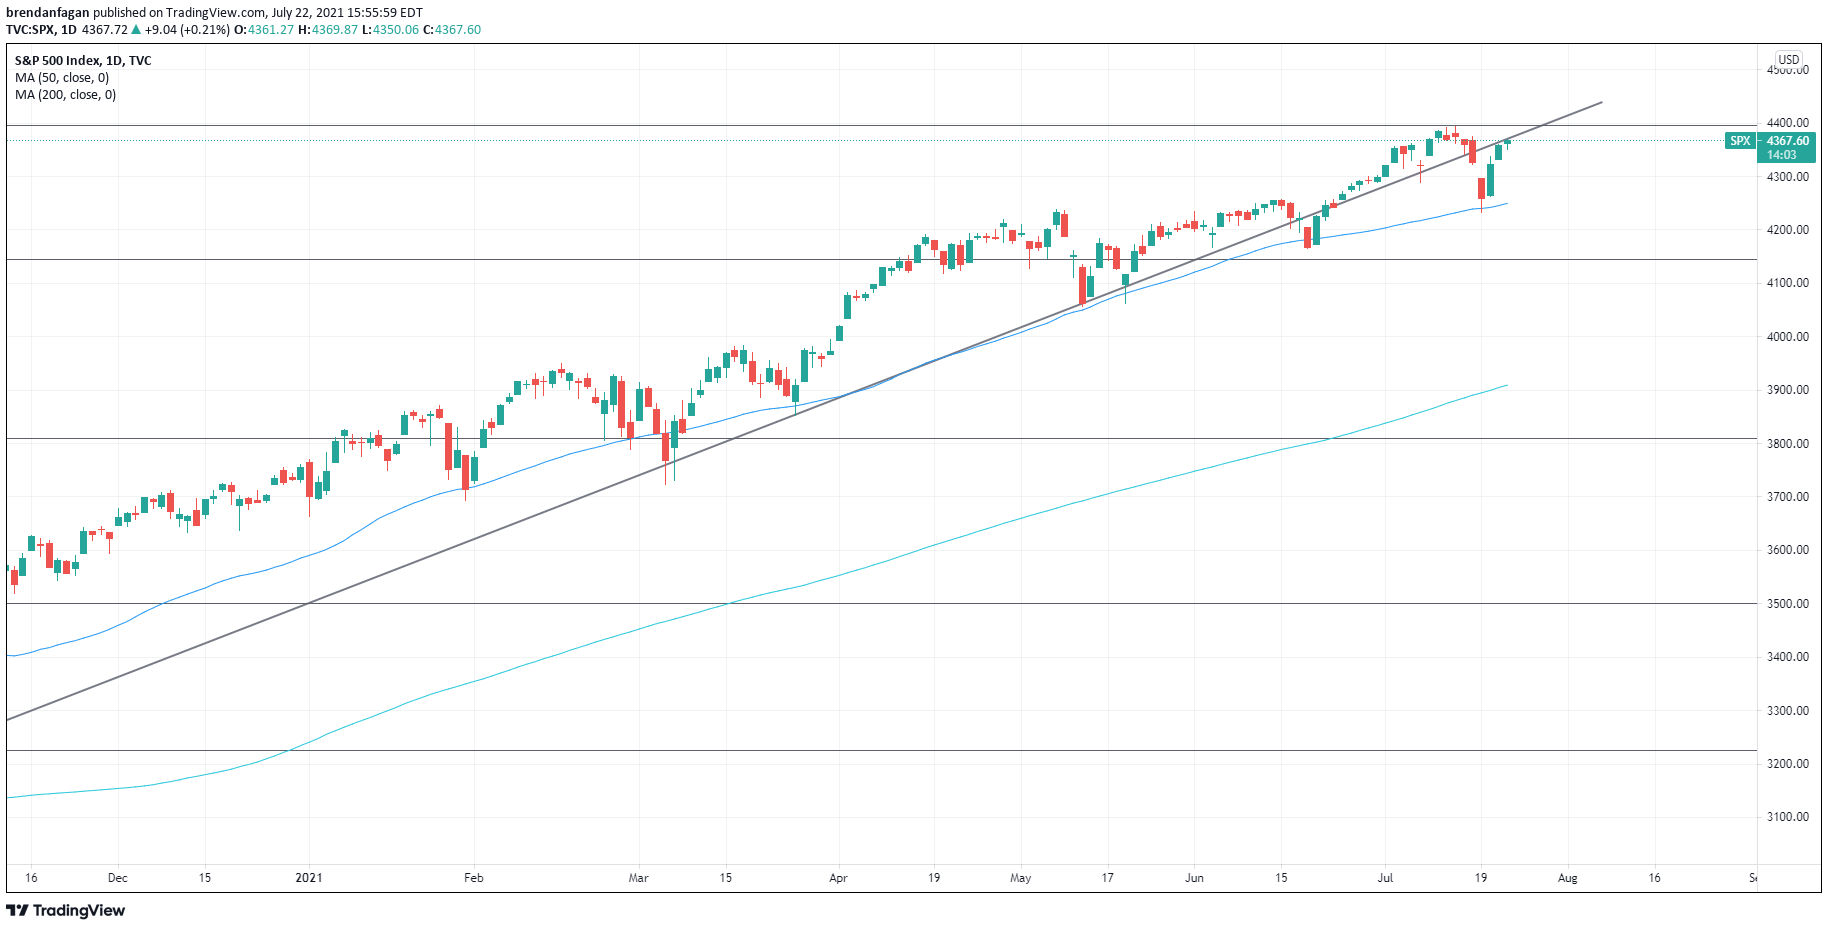
Chart provided by TradingView
Brendan Fagan, Intern for DailyFX
July 23 2021
To contact Brendan, use the comments section below or @BrendanFaganFX on Twitter
DailyFX provides forex news and technical analysis on the trends that influence the global currency markets.


0 Comments
Recommended Comments
There are no comments to display.
Create an account or sign in to comment
You need to be a member in order to leave a comment
Create an account
Sign up for a new account in our community. It's easy!
Register a new accountSign in
Already have an account? Sign in here.
Sign In Now