Crude Oil, Energy Stocks Sink on Fed Commentary. WTI at Risk on Technicals

Entry posted by MongiIG in Market News
844 views
CRUDE OIL, COVID-19, FED, IGCS, TECHNICAL ANALYSIS - TALKING POINTS:
- Growth-linked crude oil prices weakened alongside energy stocks on Wall Street
- Rising global Covid-19 cases, speech from Fed’s Clarida dented energy prices
- WTI at risk of developing bearish technical signals as retail traders go long

WTI crude oil prices fell by the most in over 2 weeks on Wednesday, succumbing to fundamental forces that did similar damage to energy stocks and the cyclically-oriented Dow Jones Industrial Average. Rising Covid-19 cases amid the spread of the more contagious Delta variant have been denting global growth prospects. China, the world’s largest consumer of the commodity, recently placed millions into lockdown to help contain the virus.
A softer ADP employment report in the United States may have contributed to the sour mood on Wall Street, weakening oil prices too. This was then compounded by relatively hawkish commentary from Fed Vice Chair Richard Clarida, who noted that conditions for raising rates could be met by the end of next year. The EIA’s report of an unexpected 3.6-million-barrel draw in crude oil inventories last week also weighed on prices.
Prior to Friday’s US non-farm payrolls report, oil prices could remain vulnerable to swelling Covid cases. The focus over the remaining 24 hours likely turns to more Fedspeak. Governor Christopher Waller and Minneapolis President Neel Kashkari are slated to speak. The former could reiterate his rather hawkish views on monetary policy while the latter may counter with his relatively dovish opinions of late.
CRUDE OIL TECHNICAL ANALYSIS
Crude oil prices may be at risk in the near term after a bearish ‘Death Cross’ emerged between the 20- and 50-day Simple Moving Averages (SMAs). The 67.94 – 66.37 inflection zone is in focus after the commodity paused its drop on the outer boundary of the range. Pushing deeper into the zone and breaking under risks opening the door to further losses. In the event of a bounce, keep a close eye on the SMAs which may act as key resistance points.
WTI DAILY CHART
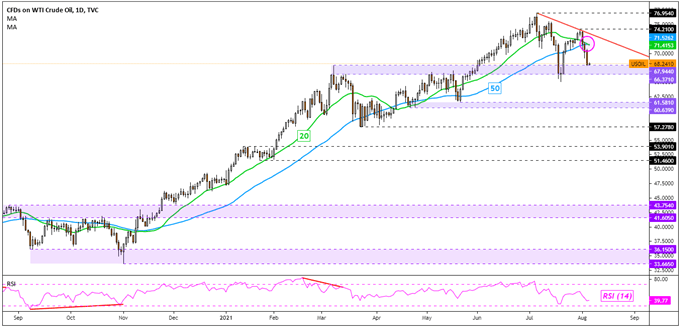
Chart Created Using TradingView
CRUDE OIL SENTIMENT ANALYSIS
According to IG Client Sentiment (IGCS), about 62% of retail traders are net-long crude oil. Upside exposure has increased by 22.59% and 45.80% over a daily and weekly basis respectively. We typically take a contrarian view to crowd sentiment. The fact that traders are net-long hints prices may continue falling. Recent shifts in sentiment are further reinforcing this outlook.
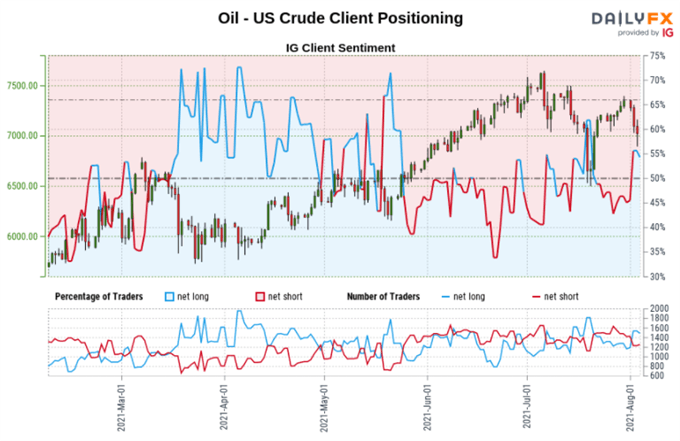
*IGCS chart used from August 4th report
Written by Daniel Dubrovsky, 5th August 2021. Strategist for DailyFX.com


0 Comments
Recommended Comments
There are no comments to display.
Create an account or sign in to comment
You need to be a member in order to leave a comment
Create an account
Sign up for a new account in our community. It's easy!
Register a new accountSign in
Already have an account? Sign in here.
Sign In Now