

Mercury
-
Posts
3,580 -
Joined
-
Last visited
-
Days Won
48
Content Type
Profiles
Forums
Blogs
Events
Community Tutorials
Store
Everything posted by Mercury
-
Stock market turning points - are we there yet?
Mercury replied to Mercury's topic in Indices and Macro Events
Looks like a small final leg up to critical resistance and now a sharp (1 hour chart) bounce back off that resistance. Not yet confirmed with support breakouts but shaping up for a classic ending diagonal/triangle set up. I often take a speculative Short (or Long in reverse set ups) off the touch and go at the potential Triangle top, which I have done here, then fast stop protection move to minimal loss positions and await developments. Another opportunity for a short is the breakout of the lower narrowing channel line. One of my key leading indicators for US large Caps, the Russell 2000, is flashing Red as well. All in all this is performing exactly as my Bearish scenario lays out.
-
FX is too tricky to trade just now for me, I am waiting for more clarity with some key breakouts or clear pattern retraces. While USD (EURUSD) looks to have started to firm up on a direction I remain in doubt about this and wonder if we will see yet another twist in FX before the large scale retrace I have been patiently tracing for may months g. Meanwhile there is a possible clearing of the mists on GBPUSD for me, still to be confirmed by price action, which is suggesting a Wave A-B is in play. I do not know yet whether or not the wave Bearish move has started, we may yet see another leg up to the Fib 50% first. In any case I am not seeking to trade this B but rather to spot the rally into the final wave C of the larger scale retrace. I am liking another retest of the breakout zone for a wave B conclusion. If this materialises it could herald a similar move on EURUSD and hence some short term strength in USD. I am expecting GBP to go through a period of relative weakness vs EUR as well.

-
Gold and Silver are broadly still following my road map. I have added what I believe is a strong channel (both upper and lower lines have a lot of price turn touches). The breakout zone of this channel offers the favourite options for a wave B conclusion (Also Fib 62%), with Fib 76/78% not that much further up this represents a strong resistance zone for me. Silver and Gold are showing some strong congruence in pattern with similarity of Channel and breakout. Wave A looks to be concluded now it remains to be seen how the potential wave B plays out. I am not really key to trade this retrace as I am waiting for a long term rally signal to go Long and there are better short term trading opportunities elsewhere in my view. So long as my road map set ups remain intact I am content to track and wait.


-
Stock market turning points - are we there yet?
Mercury replied to Mercury's topic in Indices and Macro Events
Not sure I could be quite that definitive at this stage. Nasdaq and SP500 have made new highs on the current rally while the Dow has not. The Dow was much stronger in the previous phase so we are seeing a lack of convergence between the US majors. In addition the Russell 2000, a bell weather for momentum stocks is tracking similarly to the Dow, having not made a higher high in this rally yet. I couldn't call which way this is going to play out next week but the stock indices do seem to be at a pivotal point just now. A turn down on Sunday/Monday would trigger a Bearish phase. A turn up would not necessarily trigger a resumption of the Bulls until key resistances are broken.


-
Stock market turning points - are we there yet?
Mercury replied to Mercury's topic in Indices and Macro Events
See a recent article posted by the same Cramer @elle was referencing I believe, posted below. I won't comment on it except to say 2 things: one, without a lot of talking heads talking up the market at turning points I would be nervous - contrarian turning points can't be mainstream; two, the idea that anyone, any institution, can control (or cause) a recession or a boom is total nonsense (Gordon Brown discovered that the hard way). Humans love to explain stuff (to rationalise); feel they can control their environment and, chiefly, seek to blame people for bad things (It must be someones fault or else things are too chaotic to comprehend - well they are, that is what chaos theory is all about). In reality, I believe, it is group think and herd mentality that causes booms and busts. And this is driven by the above mentioned human desire (need even) to rationalise. What institutions like central banks CAN do is amplify the cycle by intervention. Americans are the ultimate purveyors of the so-called free economy but the level of intervention since Greenspan (not just Bernanke) is hardly a free economy. This intervention, which is now a global phenomenon, has staved off the crash and reset that some believe ought to have occurred as a result of the credit crunch and amplified the resulting boom to bubble proportions. The inevitable bust will be, as a result, much more painful that it would have been in 2007. In fact we might now be touching bottom and beginning to come out of it but instead we may have 10 years or more of depression to content with. The reason people like Cramer et al have a ready readership as no one wants to believe what I have just written above, it is too awful to contemplate. OK believe what you want to believe if it make you feel less emotionally fragile but surely the logic of it as a credible scenario would lead you you plan for the worst..? As for me I plan to take full advantage of the Bear when it comes in my trading account to offset other impacts elsewhere, why wouldn't I? https://realmoney.thestreet.com/investing/stocks/jim-cramer-it-is-time-to-burst-the-fed-bubble-thesis-14862451 -
Gold is getting a small bounce but is that on the back of stocks Bearishness, USD apparent strength or something else. I can't really tell right now and unless Stocks are following my #2 scenario (see USD indices, are we there yet thread) I can't really see this as the end of the larger retrace. So I remain with my previously posted road map. This rally will, under that scenario, either trace a wave B from here or give us another small leg down before it does. After that comes a longer wave C to complete the retrace, possible as low as a retest of the prevailing long term supporting trend-line, which would suck in a lot of precious metal Bears, prior to a long, long rally. For precious metals I feel it is important to watch USD moves in the short to medium but overall economic and stocks moves for the long term. The Negative Momentum Divergence is still dominant in the technical set up for me but Stochastic is over sold so a period of bullishness is likely, remains to be seen whether this will turn back down before a higher high or run up to hit the the overhanging resistance first before any medium term retrace. This uncertainty means precious metals are not a good bet right now for me. I am content to hold Longs from way down for the long term, having cashed some on a dual bet strategy. I am waiting for this current pattern to trace out before looking for additional Longs but I will not be taking precious metals Short nor swing trading in what I expect to be a volatile (whip plash type - not the good type) period and view the set up as too uncertain. I would rather look to swing trade stocks and main USD FX pairs that Gold/Silver at present.

-
Stock market turning points - are we there yet?
Mercury replied to Mercury's topic in Indices and Macro Events
Are we there yet? I think so but it is not yet conclusive. The turn on the Dow occurred just below the Fib 88%, which was a very strong retrace rally indeed. However all the signs of the turn were there with a pin bar off the upper narrowing channel line and then a lower high retrace (where I went short). The Market then broke out of the channel to the downside (another bearish signal) and went on a strong drop that stopped after bad economic news (US NFP), hmm... There have been some minor divergences on shorter time-frame charts, a signal that the trend is weakening. However that strong late reaction rally suggest a further retracement is likely before the next phase of the bearish move. I suspect this retrace may carry as far as a retest of the channel breakout. Of course no one can 100% discount the marketing over exuberance continuing to a new all time high but I don't see that as the highest probability scenario at this stage, there are too many economic headwinds for me. This is my scenario 3. The other 2 scenarios I have in play are: this will be a drawn out struggle between Bulls and Bears that will drive a so-called complex retrace with a lot of whip lash (we have certainly had that so far) before the Bulls will eventually realise the game is up and then we turn into a massive wave 3 down The game is already up and the turn down into the big one has just happened Time will tell, for now I remain Bearish, I will hold my Shorts and await events.

-
The USD is still in consolidation, as is EURUSD unsurprisingly. These things take longer than one expect usually. So the question remains, will it break up into a long term rally or down into a significant retrace before hitting out on that long term rally. Note I do not entertain the scenario where the USD goes into free-fall from here. Main reason is that I am pessimistic about the long term outlook for the global economy. We have had it too good for too long and all the signs of a major recession (or worse) are there for me (including paid for economists saying it wont happen... yet!). Stock markets and economies (at least on paper!) have been fueled by central bank policy, which I believe will be studied intensively in the future and declared a disaster. Recently central banks have made a halfhearted attempt to pull back from their policy excesses, because they likely know in their respective guts that the economy has not responded and to continue is futile, they cannot get the inflation they are seeking to erode the debt excesses. The Eurozone economies as a whole are a basket case. China is flagging, unsurprisingly as they have been overheated for too long and (in all likelihood) being incorrectly represented in official data (although of course no one could prove that so let's say I take the prudent approach of discounting the official data). Emerging economies are struggling with USD denominated debt burden. Even the US economy is not as rosy as it seems, but likely still more stable than most. Trump policy seems to be to pull in to a US defensive posture to further stabalise it. Brexit is not helping the EU cause but is not the driver of their parlous state, the Eurocrats are terrified that the UK might be more successful outside that in, which they may well be, if for no other reason that they will not get plled down in the Eurozone meltdown that is, I believe, inevitable. The Eurozone economic model is not stable and therefore not sustainable and neither is the currency. In terms of policy, the central bankers must know that the end is nigh but who wants to be seen as the one who triggered the fall..? The alternative to carrying on is to admit error and reverse, which would trigger the very thing they have been trying to fend off, a depressionary recession. But to carry on with the same strategy that has not worked bears all the hallmarks of the theory of insanity often attributed (erroneously perhaps) to Einstein - "doing the same thing over and over again and expecting a different result". And they are not alone in this. How many times have we read the great and the good say "that this time it is different" or talk about the "new normal". LOL! Now the ECB seemingly wants to open the pumps again... Oh Oh! So much for the fundamentals, which can only supply the backdrop for me. I need triggers to trader so I use a technical analytical method to frame the fundamentals into real-time price action. The DX move up since early 2018 has described a Triangle formation with significant resistance overhead now including the Fib 62% and a cross resistance point (2 or more trend lines intersecting). That this occurs at the Fib 62% level may be indicative of a major inflection point. There is significant negative momentum divergence (NMD) in play just waiting for a final trigger to push price into a Bearish move. The EWT count has yet to see a significant 1-2 retrace. Previously I had thought the Nov 18 top might be the wave 1 top but another leg up is now on and that critical inflection point now comes into sharp relief. Looking at the Daily we also see a more recent Daily NMD plus other oscillators firmly over bought. On the current rally the desired 1-5 form has not yet completed, so a bit further to go perhaps to test that resistance zone. On the EURUSD chart you can see the same Triangle in reverse and in this case of course PMD. Net I expect another leg up on DX (down on EURUSD) before that significant EWT1-2 retrace, the termination of which will signal the final turn to complete the overall bearish move on play since the Credit Crunch. When this triggers (i.e. a massive USD rally) it will likely coincide with that stocks crash I have been banging on about for a few years now plus the precious metals rally I am seeing signals of all over the place. So that's what I think, does anyone have a materially different view? I would love to hear it.


-
Stock market turning points - are we there yet?
Mercury replied to Mercury's topic in Indices and Macro Events
US indices are at or have broken near term support zones. Given the nature of the bearish moves I am viewing this as a trend change. I am not saying pile in, markets move in zig zags as we all know. I am Short from key breakout points and stop protected at Breakeven. I will be looking to sell into rallies at key resistance zone turning points with close stops above those turning zones. My medium term targets for this move are around the Fib 62% or 76/78% support zones. Depending on the nature of the move and the sum total of signals at these turning points I will assess whether a swing or hold approach (or indeed a split approach) is indicated.

-
Stock market turning points - are we there yet?
Mercury replied to Mercury's topic in Indices and Macro Events
Russell2000 makes new lower lows and breaks support zone. This index can be a it of an advance indicator for the large caps, it certainly looks like it this time.
-
Stock market turning points - are we there yet?
Mercury replied to Mercury's topic in Indices and Macro Events
Nasdaq is setting up nicely for a strong bearish move, as are the other US large Caps. In the case of the Nasdaq through the recent relief rally was stronger, penetrating back through the channel line to top out at the Fib 78%. This was coincident with the top of the prior gap, a zone that supply/demand theory would have as a strong buy/sell point. The theory goes that a gap leaves traders behind and when the gap is closed this traders will dive in. In this case the bearish move was fast and strong, closing the gap with little chance for traders to get in. The relief rally topping out where it did offered those traders the chance to get in. Looks like they were predominately Bearish... I am particularly keen on these types of set ups where several methodologies combine to show the same result. For me this adds credence to my Bearish stance at this juncture. I am anticipating a fairly substantial drop from here.
-
Stock market turning points - are we there yet?
Mercury replied to Mercury's topic in Indices and Macro Events
There has been a lot of chatter about the Bullish nature of the stock indices and about bias etc. As a Contrarian I love that. I also use the COT differently as a result, looking for a lob sides bias in the market place. So far it looks like the Dow (and other US large caps) are leading the way down. The Dow is my main vehicle and turned without making a higher high and has now broken the narrowing channel support line with some force and closed below key support zone on the hourly chart. We could see some retrace rally action in the run up to the close today and I will be awaiting the end of day position on the daily chart to assess whether this is a confirmed turn. but so far it looks good. The key for me was to get Short early, which I did once again at the wave 2 turn on key resistance and on breakouts of the channel lines. The Sunday evening opening Gap was a key factor for me in determining a Short trade as I felt reasonably sure this gap was not a breakaway and so would be closed. One it was closed I narrowed stops to guard against a reversal (the kind of thing we have seen at the other resistance points on the rally up so far). Thankfully the market carried on down. At this point I will be holding my Shorts stop protected at break-even and deploying a sell the rally strategy until I see signals of another medium trend reversal OR a break of the Christmas low, whichever presents itself. Obviously in the case of the former the indicted action will be to cash Shorts and swing Long and in the case of the latter hold for the long term. First though we need to see a confirmed trend change. Some interesting factors for technical traders to note: Dow didn't make a higher high but Nasdaq and SP500 did. FTSE100 has been weaker, making a turn 15 Feb. Dax and Nikkei have turned at much lower levels that the US large Caps, which have also turned at different levels (Dow being the strongest making it all the way to the Fib 88% or thereabouts). This divergence but turning at respective important resistance zones is instructive. Oil and precious metals seem to be in congruence with stock indices at present, the former in particular perhaps. There were no data releases to trigger today's US indices turns... There was no material news that I can see, although I expect the usual attempts at post hoc justifications. Whatever you views on all that there is no denying that a turn looks likely, subject to today's closing price action. Dow 1 hour chart attached, similar read on others but the Dow (and Russell 2000 actually) were first to go.
-
My EURGBP Short trades have been going well. My current assessment is that a major breakout to the Bearish side has occurred with the break of the Triangle. There has already been a short term retrace and retest of the Triangle so Shorts above this zone are good holds. However we could easily see another significant retrace and retest occurring over the coming retrace/consolidation continuation period that I believe will be a feature of the markets in general until the Summer. It is clear that GBP has been stronger than EUR of late but looking at the EURUSD and GBPUSD charts I see more potential for EUR rally (as in a stronger rally). Obviously if this occurs EURGBP will also rally. If we do see such a retrace any turn back off the Triangle line or breakout zone will be a very good shorting opportunity.


-
Didn't see your comment until today @psycho so any comments are obviously with the benefit of hindsight. I had wondered if this rally would make it to the potential Head & Shoulders Neckline up at around 1360 but the market looks to have fallen short of this. Regardless I was expecting a large time frame EWT 1-2 retrace , which I believe has just started. This could take a bit of time to play out, although the move down on Silver has been fast. For me such a move is likely to be volatile and, if it coincides with my lead scenario for indices (a complex retrace) could play out towards May. Note that on Gold there was a spike on the COT data with the Non Commercials jumping into net Longs just as the market turned. As a contrarian this is a good signal of the end of a rally, I exited my Longs shortly thereafter. I will sit this out for now and await a confirmation of a retrace completions before looking to get Long for a Long, Long rally. BTW: although I have shown Silver retrace terminating at the neckline breakout zone this is indicative only at this stage, as all my road maps are, and I would not be surprised to see the long term supporting trend-line retested on Silver.


-
The overall USD picture looks like a retrace rally to me. I will be watching for a turn down on this market to coincide with key USD pairs. Although not surprisingly there is an unbroken Triangle formation as with EURUSD to contend with and an overhead long term resistance trend-line, which could result in a higher high before a retrace.

-
The current rally seems to have stalled, as with GBPUSD. Currently I see this as an EWT 1-2 retrace. This pair may already have put in the A-B. I am looking for a rally off key support to add to Longs. Note this pair has not yet broken out of the Weekly Chart Triangle, which means a trend change is not confirmed for me. Any trend change will, I think, be a large scale retrace only. A conservative approach would be to wait for a Triangle break out. However if the 1-2 retrace plays out a Long at a key support turn with tight stops would be fine for me.


-
Momentum definitely appeared to be slowing @cryptotrader but as is often the case it took a while to reach a tipping point. On the Hourly chart there was a Neg Mom Div at the recent high. I think the current bearishness is a retrace EWT 1-2 to set up a further rally. I am looking for a further drop in A-B-C form before considering adding to my Longs. Although as EURUSD hasn't yet broken out of its Triangle channel (and charting convention has it that you trade the breakout) we may yet see a breakdown. For now though I am Long biased so will look to go Long off turns at key support levels.


-
Stock market turning points - are we there yet?
Mercury replied to Mercury's topic in Indices and Macro Events
Ha! Thanks for that @elle all grist to the mill I guess but like you, I trade what I see. I needed to see a Bearish end to the week and we didn't really get that, out of hours trading on FTSE, Nikkei and Dax was overly strong vs the live US indices. However the Dow, which is my main vehicle, is still showing a failed retest of my channel line. I would be a lot stronger on this set up if other indices were showing similar reactions but they are not, especially the Nasdaq. In the case of the Nasdaq it could be on for a double top, which is consistent with the Bulls not being able to give up the belief that the central bank fueled run will go on forever ("The new normal"). I will await Sunday opening with interest to see if we get a Bearish start to the week or fresh highs on this rally (another leg up).10319.thumb.png.3a5f8a2831a103a4e472c9a4fe775ac1.png)
-
Stock market turning points - are we there yet?
Mercury replied to Mercury's topic in Indices and Macro Events
Dow Hourly shows the 1-5 down to a potential wave 1 and the A-B-C retrace with turn and strong bearish move off key resistance.
-
Stock market turning points - are we there yet?
Mercury replied to Mercury's topic in Indices and Macro Events
Or USDJPY set to go down? Coming up on a strong resistance zone. As regards Indices looks like there is a strong case for a retrace rally end this past hour or so with a significant turn at key resistance on the Dow (similar pattern of others). Not confirmed yet but the signals remain in play for me. Need to watch the closing stages of the US session this evening for more clues.

-
Stock market turning points - are we there yet?
Mercury replied to Mercury's topic in Indices and Macro Events
Here is my version of the big picture on USDJPY @elle, I have a similar line but notably there is an area of resistance where this market has turned a couple of times around the Fib 62% and this zone runs through a Weekly gap (already closed but a chartist loves zones of resistance or trend-lines that run through such historic gaps. I really don't have a good LT view on this pair but the Yen does seem to strengthen around stock indices weakness, hence the question. On balance, re stock indices, I am probably leaning towards a a bearish move followed by a further Bull move to complete a complex extended retrace through to early Summer but of course can't be sure of that yet so have to consider that any turn could be the final nail in the Bull coffin. Also, naturally, cannot 100% rule out fresh all time highs so care is required to guard against such an event in terms of stop placement and judicious profit taking.

-
Stock market turning points - are we there yet?
Mercury replied to Mercury's topic in Indices and Macro Events
If USDJPY is any kind of leading indicator for for stock indices then the current movement is interesting...
-
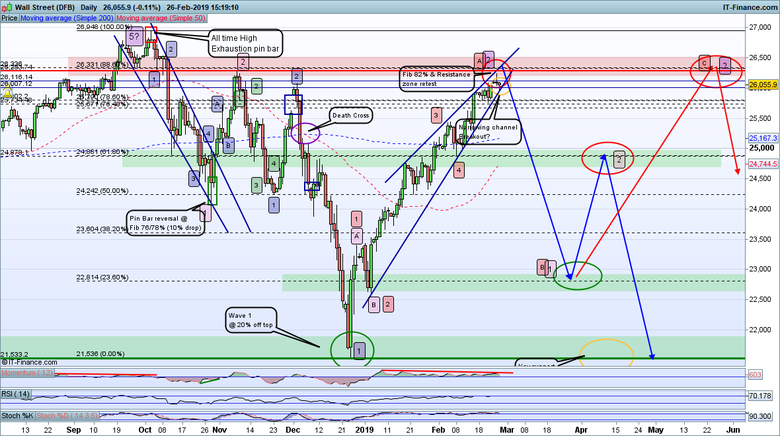
Does anyone know what the markets are going to do next? No, me neither. However I use my methodology to identify likely turning points and assess the risk against my long term scenarios (or road maps). As a swing trader this is an important aspect of trading, otherwise you are sitting around waiting to join a well established trend, which means wider stops and therefore greater exposure to loss; or you are trying to jump on a sudden move (day trading), which is not a long term swing trading approach (usually because we are not glued to the screens all day every day). I prefer to take on a small exposure several times and even seek to take that exposure down to zero, which is what I did the other day on the US indices (see my thread on US Indices, the big one). Others prefer a different approach that works for them, which is perfectly fair and not for me to criticize. People often talk about bias as a bad thing. This I disagree with for several reasons but chief among them is that everyone has a bias all the time. The key is to be sufficiently self aware to recognise your inherent bias and guard against throwing caution to the wind off the back of this. For me this bias is that the market has (or will soon if Oct 2018 turns out not to be the top) shifted from the runaway Bull to a Bearish footing and that this will be the beginning of a massive Bear move that will last several years. I don't mind being wrong so long as I don't lose much in my efforts to find an entry to capitalise should I be right. All of the top traders who people quote and defer to take positions within a premise (whether Technical or Fundamental or both or even from a valuation perspective for individual company shares) for what is going to happen next. This is a bias. Therefore, for me, the only way to make some serious capital gains on trading is to do exactly that. Of course this is a long term swing trader view point. I daresay day traders can simply bend with the wind each day, but I am not a day trader so can't comment on that. When you are engaging in a discussion around trading it is important to know the people you are doing so with in terms of their trading type. I don't listen to day traders because I don't day trade, not because they are wrong. It is just wrong for me and my method. If you listen too the wrong kind of people you will undermine confidence in your own methodology and if you don't have this you cannot be successful. BTW, even if you have all that you can still lose money if you do not practice tight money management. With all of that it is no wonder so many retail traders lose... A couple of other observations/saying that are relevant to this topic: Buy low/sell high - well we are about as high as we can be on indices right now The trend is your friend - yeah until the bend in the end! If you do not have a methodology to identify this inevitable bend then not only do you lose out on opportunity you also hold onto old trend positions far too long based on the original bias, resulting in impaired gains and at worst gains tuning into losses. This turns into the opposite of saying #1! Buy weakness, sell strength. Indices are seemingly strong now but are they really? So within that context (and let's hope no one feels the need to argue about that!), here is my case for stock indices turning back into a bearish phase. I currently believe the top was hit in October (my bias). Unless or until we see a fresh high high that position I will retain. The problem we have is that after such a strong Bull market it will not turn Bearish without a fight. The Bulls almost cannot conceive of a situation where the current bull market will end. There are plenty of examples of people talking up the market. Given this backdrop a retrace move (i.e. the long breath before the plunge) could go all the way to a double top formation. Therefore my approach is to assess each resistance zone as it is approached and watch for a trigger. When a move down is a trigger, according to my method, I take a position with a close (low exposure) stop. If I see the move flame out I exit or move stops to break even (or there abouts) to guard against a reversal, which is what happened end of last week on US indices. and begin the process again, with little or no loss. So where are we? I see all major indicies at key resistance (potential turning) points (see below), with the additional indicator of strong Negative momentum divergence and other oscillators in the over bought zones. I see a credible EWT A-B-C formation. On the hourly I currently see a small 1-5 down and now in retrace. If we get a small A-B-C up followed by a bearish move down past recent lows that will form a lower high, lower low combo. If we also see a breakout of narrowing channels we may be on for a bearish period. However I cannot say whether this is the final retrace before the big one (quite likely with the Dow at Fib 82%!) or a wave A resulting in a further wave B-C to May time. But before I worry about that I want to see the first turn and get in on that: Major indices on the Daily look like this: The Dow has almost reached the Fib 82% at a significant turning point from Pre Christmas. We saw a strong Bearish move from this point pre Christmas - markets have memories! Also a significantly narrowing channel and NMD suggests the power of this move is waning. Nasdaq looks similar but falling between Fibs 62% and 76% but at a key resistance zone nonetheless, being the long term channel breakout zone. S&P is again similar but this time right in the Fib 76/78% zone, which is also a key turning point 3 times prior to Christmas. Russell2000 is almost identical to the Nasdaq (both are momentum stock heavy) FTSE is weaker, having topped out earlier and is appears to have already turned at the Fib 50% zone, again coincident with the long term channel line breakout zone. The Dax is the weakest of all the Western markets, having topped out first and is only making it to the Fib 38% at present and again coincident with its long term channel breakout zone Finally the Nikkei, which is on a different route map having topped out in the late 1980s but topped out the current Bull run in Oct, same as for the US markets and like the FTSE100 has only achieved the Fib 50% on the current retrace.


-
Do a google search @gautamhait but research them carefully, there are a lot of snake oil salesmen around. I can't recommend any because I don't use them. If you are going to use any make sure they use a methodology similar to yours. Regarding Gold, it looks to me that my long term road map remains intact. Precious metals went into a consolidation phase as suggested previously but may now have bounced back into a continuation of the rally phase. If we see a fresh higher high soon I will be keeping a beady eye on price action as the potential neckline resistance zone is approached. Currently I am anticipating a fairly significant rejection around this point (+/-) into a wave 2 bearish retrace but this would be just a prelude to a much stronger rally phase.

-
GBPUSD has been behaving better than EURUSD of late, curious one would have thought if BREXIT mattered it would matter more to GBP but then this is why I don't waste too much time overthinking such things (Que Sera Sera and all that...). I prefer to watch the price action and map it with scenarios as they unfold. I have been chasing a USD retrace for some time and it has been a long time in the making but perhaps it is finally here. Price action on Friday may be the moment I look back on and say "yes that was the signal". I have written elsewhere on DX and EUR but GBP could be ahead of the game this time. A quick look back to the Weekly to show a possible wave 1 completion with the market now perhaps turning to complete the Wave 2 after a period of Bearishness over the past few weeks. Target remains in and around the 14,000 level. On the Daily I still have a valid Triangle breakout and now a retest of the breakout zone in a possible Wave B completion. My only concern is that there could easily be another leg down to this pair while EURUSD simply retraces (i.e. doesn't make a lower low). The reasons are that the Fib 62% lies just below and this coincides with a strong pin price action move on the previous rally. In addition I don't see much PMD about. The market should reveal this next week.


10319.png.a630af3c5be721641cee1c4f34e33d08.png)


