Jump to content

British Pound Slips After Data, Still Tied to Range. Can GBP/USD Break Out Ahead of FOMC?


MongiIG

1,569 views

BRITISH POUND, GBP/USD, US DOLLAR, ENERGY, COMMODITIES - TALKING POINTS

  • The British Pound weakened after data but managed to hold some levels
  • Energy commodities calmed down today, as did most asset classes in Asia
  • With FOMC next week, is this a quiet before the price wrecking storm?

Pound New Zealand Dollar Exchange Rate Wavers


The Great British Pound moved lower after US and domestic data today. Energy commodities took a breather in the Asian session, as did most equity, bond and currency markets.

The US Dollar gave up some ground in the Asian session after rallying in the US as the stellar US retail sales number of 0.7% m/m for the month of August defied expectations of

-0.7%. This is on the back of last month’s -1.1%, which was revised to -1.8%.

Energy commodities have seen moves to elevated prices this week due to severe capacity concerns remaining in several key pockets of the global supply chain. Namely, the Mexican Gulf storm season, the English Channel power connection outage and shipping bottlenecks.

The Baltic freight index is showing the cost of transporting energy commodities at the most expensive in 13 years. With the oncoming Northern Hemisphere winter and Western Pacific typhoon season ahead, markets are nervous about the impact on growth amid high inflation. Several parts of Asia have seen the cost of power rise to the point of being forced to shut down some factories.

GBP/USD moved slightly lower again after UK retails sales disappointed at -0.9% m/m for the month of August. This print came in well below the forecast 0.5% and a previous reading of -2.5% that was revised down to -2.8%.

Looking ahead, today the University of Michigan consumer sentiment data will be closely watched, but the FOMC meeting next Thursday remains in front of mind for markets.


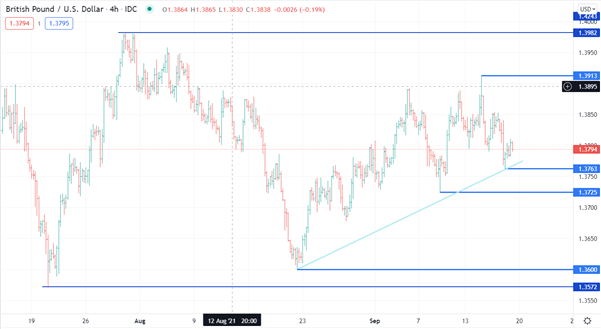
GREAT BRITISH POUND TECHNICAL ANALYSIS

GBP/USD has been trading in a range for 2 months between a low of 1.3572 and a high of 1.3982. These levels may now provide support and resistance respectively, should they be tested.

More recently, the high of 1.3913 could offer resistance while the previous lows of 1.3725 and 1.3600 might provide support. The very recent low of 1.3763 is a trend line currently at 1.3770 may provide support.

British Pound Slips After Data, Still Tied to Range. Can GBP/USD Break Out Ahead of FOMC?

Chart created in TradingView

Written by Daniel McCarthy, Strategist for DailyFX.com. 17 September 2021

0 Comments


Recommended Comments

There are no comments to display.

Create an account or sign in to comment

You need to be a member in order to leave a comment

Create an account

Sign up for a new account in our community. It's easy!

Register a new account

Sign in

Already have an account? Sign in here.

Sign In Now
  • Blog Statistics

    • Total Blogs
      3
    • Total Entries
      2,822
  • Latest Forum Topics

  • Our picks

    • International Workers' Day & Early May Trading Hours
      Please be advised that our opening hours will be adjusted on 1 May 2024 for International Workers’ Day and 6 May 2024 for the UK Early May Bank Holiday. Where appropriate, the times listed are in GMT.
        • Like
    • Are these the best AI stocks to watch in May 2024?
      Microsoft, Apple, Nvidia, Amazon and Meta could be the best AI stocks to watch next month. These stocks are the largest AI stocks in the US based on market capitalisation.
    • Natural Gas Commodity Elliottwave Technical Analysis
      Natural Gas


      Mode - Impulsive 


      Structure - Impulse Wave 


      Position - Wave (iii) of 5


      Direction - Wave (iii) of 5 still in play


      Details:  Price now in wave iii as it attempts to breach 1.65 wave i low. Wave (iii) is still expected to extend lower in an impulse.


      Natural Gas is currently breaching the previous April low, marking a decisive move as the impulse initiated on 5th March continues its downward trajectory, further extending the overarching impulse wave sequence that commenced back in August 2022. This decline is anticipated to persist as long as the price remains below the critical resistance level of 2.012.


      Zooming in on the daily chart, we observe the medium-term impulse wave originating from August 2022, which is persisting in its downward trend after completing its 4th wave - delineated as primary wave 4 in blue (circled) - at 3.666 in October 2023. Presently, the 5th wave, identified as primary blue wave 5, is underway, manifesting as an impulse at the intermediate degree in red. It is envisaged that the price will breach the February 2024 low of 1.533 as wave 5 of (3) seeks culmination before an anticipated rebound in wave (4). This confluence of price movements underscores the bearish sentiment prevailing over Natural Gas in the medium term.


      Analyzing the H4 chart, we initiated the impulse wave count for wave (3) from the level of 2.012, which marks the termination point of wave 4. Notably, price action formed a 1-2-1-2 structure, with confirmation established at 1.65 and invalidation set at 2.012. The confirmation of our anticipated direction materialized as price breached the 1.65 mark, signifying a resumption of bearish momentum. Presently, there appears to be minimal resistance hindering the bears, thereby reinstating their dominance in the market. It is projected that wave iii of (iii) of 5 will manifest around 1.43, indicative of the potential for the wave 5 low to extend to 1.3 or even lower. This comprehensive analysis underscores the prevailing bearish outlook for Natural Gas in the immediate future.


      Technical Analyst : Sanmi Adeagbo
       
        • Like
×
×
  • Create New...
us