USD Price Action: US Dollar Rallies to Sept High, Focus Shifts to the Fed

Entry posted by MongiIG in Market News
1,594 views
US DOLLAR TALKING POINTS:
- The US Dollar is pushing up to a fresh September high after the release of University of Michigan Consumer Sentiment data.
- Next week brings the September FOMC rate decision and it’s a quarterly meeting, which means we’ll get updated projections and forecasts.
- The analysis contained in article relies on price action and chart formations. To learn more about price action or chart patterns, check out our DailyFX Education section.

The US Dollar came into the week sticking with a fairly well-defined range. And that range held through the first few days of this week, through a CPI report on Tuesday and a really strong retail sales report yesterday.
On the heels of that retail sales report the Greenback budged above range resistance, and this morning saw another data point prod USD bulls, helping to set a fresh September high in the currency.
This morning’s University of Michigan Consumer sentiment data came out below expectations but above last month’s read. Last month produced a 70.3 marker and this morning brought an expectation for a 72 print. The data came out at 71 so, a bit higher than last month but still inside of expectations.
Inside of the report – inflation expectations edged up to 4.7% from last month’s 4.6% and this is likely what’s catching the attention of USD bulls, along with overall consumer expectations, which printed at 67.1 versus last month’s 65.1.
US DOLLAR TWO-HOUR PRICE CHART
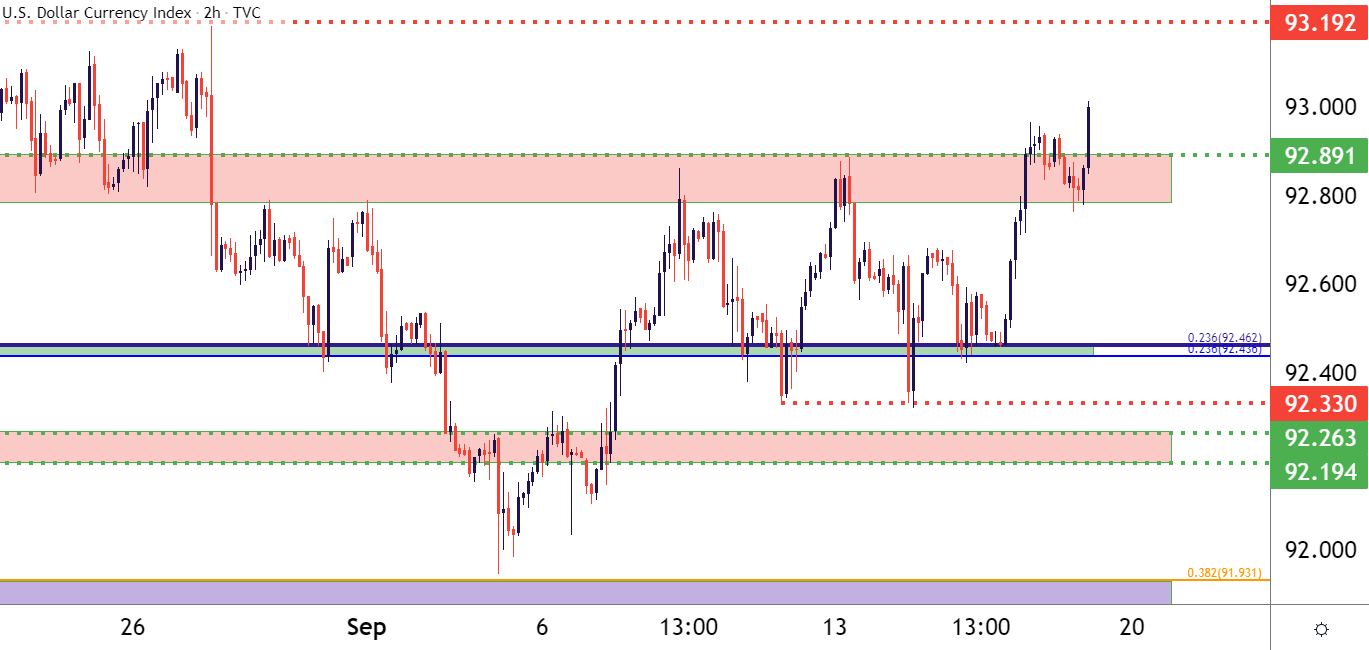
Chart prepared by James Stanley; USD, DXY on Tradingview
FOCUS SHIFTS TO THE FED
Well, the September FOMC rate decision is now right around the corner, and this has been waited on for some time. The big question is whether or not the Fed will begin to roll out details on tapering asset purchases, which, as of July, most members of the FOMC had said they expect to begin at some point this year.
But, in July when we heard from Chair Powell at Jackson Hole, he noted that employment hadn’t yet met the marker of ‘significant further progress’ that the Fed was looking for before making the move. And then the NFP report earlier this month was abysmal so, the Fed may not yet have the willingness to move towards less loose monetary policy at this point, and any delays on taper could entail both USD-weakness along with another shot-in-the-arm to the risk on move around global markets.
On a longer-term basis, the US Dollar remains in a state of mean reversion, as looked at in the Q3 forecast on the currency; and price action is approaching some key watermarks on the chart. A bit higher is a swing-high around 93.20 and a little above that is the Q1 high at 93.43. The next level up is the 2021 high, plotted at 93.73.
To learn more about the Federal Reserve, check out DailyFX Education
US DOLLAR DAILY PRICE CHART
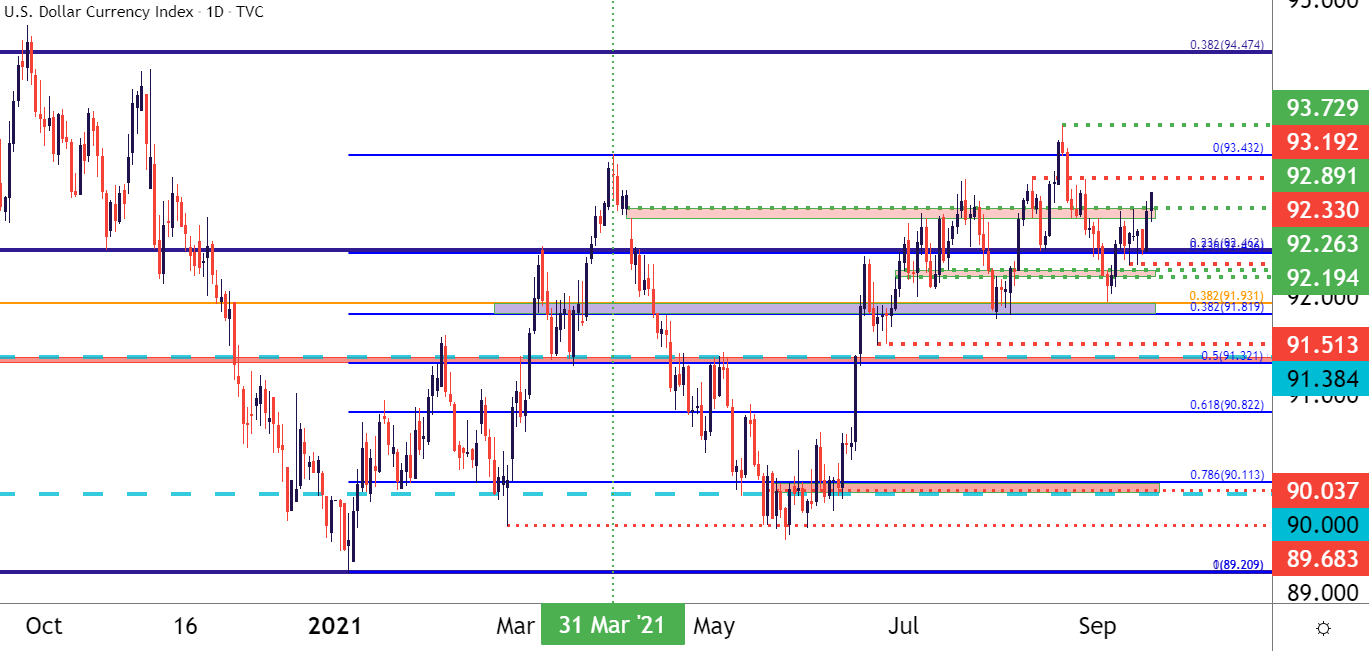
Chart prepared by James Stanley; USD, DXY on Tradingview
Written by James Stanley, Senior Strategist for DailyFX.com. 17 September 2021.


0 Comments
Recommended Comments
There are no comments to display.
Create an account or sign in to comment
You need to be a member in order to leave a comment
Create an account
Sign up for a new account in our community. It's easy!
Register a new accountSign in
Already have an account? Sign in here.
Sign In Now