Gold at risk of protracted declines as hawkish Fed outlook lifts yields

Entry posted by MongiIG in Market News
2,868 views
Gold looks at risk of a protracted period of decline, as rising yields highlight the potential for long-term weakness for the precious metal.
 Source: Bloomberg
Gold at risk if yields continue to rise
US 10-year treasury yields have kick-started after a prolongued period lull that saw yields fall back from the peak in March.
The Federal Reserve (Fed) appears ready to start tapering in the coming months, and the premise of 2022 rate hikes brings expectations of further upside in yields as we go forward.
The chart below highlights why the trajectory of yields is crucial for any gold trader. Invariably, we have seen yields track a downward path over the long-term, which has also helped bring about a long-term uptrend for gold.
The chart below highlights exactly that, with the ongoing downtrend in 10-year yields bringing strength for gold (inverted on the chart).
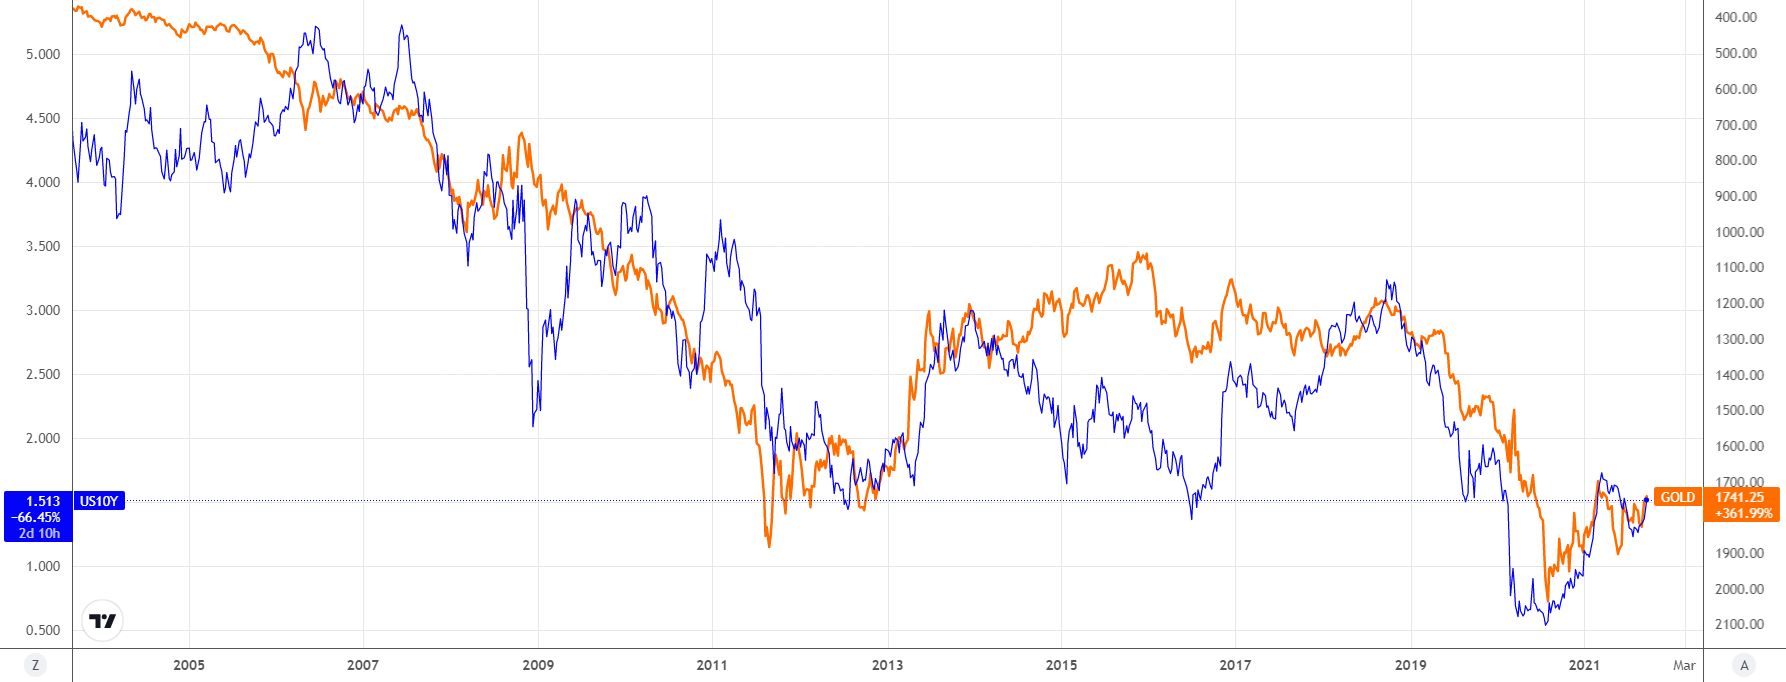 Source: TradingView
Rate hikes often bring higher yields
Nonetheless, yields often rise during periods of monetary tightening. The image below points towards this trend, with yields starting to rise often slightly ahead of those periods of monetary tightening.
Meanwhile, that rise in yields also seems to fall off as the rise in rates draws to an end.
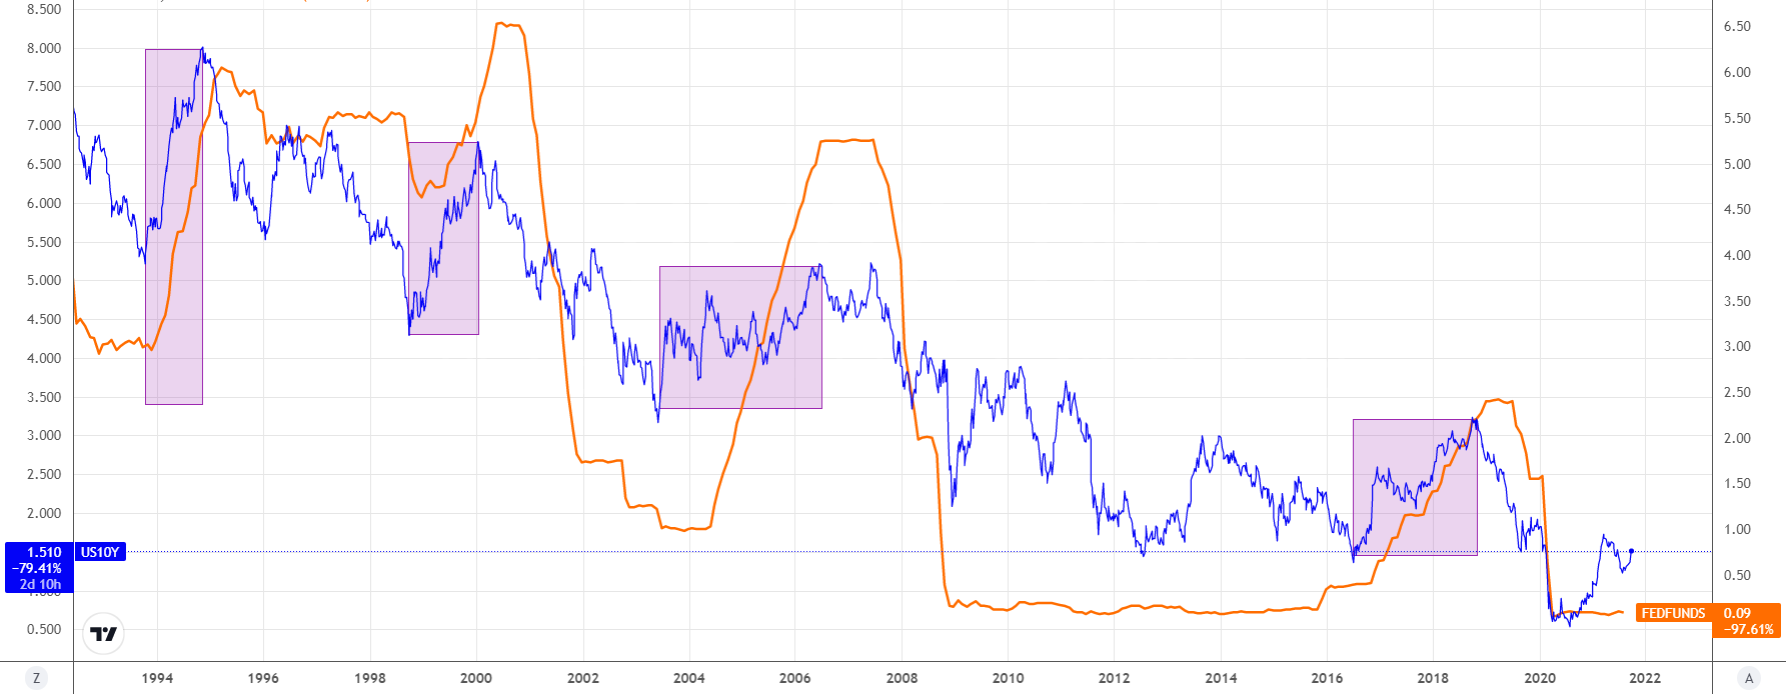 Source: TradingView
With both those factors in mind, we can draw a conclusion that in the event the Fed continues to move towards monetary tightening, yields will likely rise and gold will suffer.
The long-term downtrend for yields does still hold, meaning that any such downside for gold could be another long-term retracement within its uptrend. Nonetheless, it does highlight the risks ahead for precious metals.
Gold technical analysis
Looking at the gold chart in isolation, we can see that the monthly chart signals how we could be within another prolongued retracement period alike to 2012-2015.
Notably, it was in 2012 that the US 'taper tantrum' occurred. Thus while it took many years beyond 2012 for the Fed to raise rates, tapering of asset purchases can also play a role in damaging sentiment around gold.
Crucially, this current phase does look strikingly similar to the beginning of the decline in 2013. That highlights just how important the $1677 support level could become.
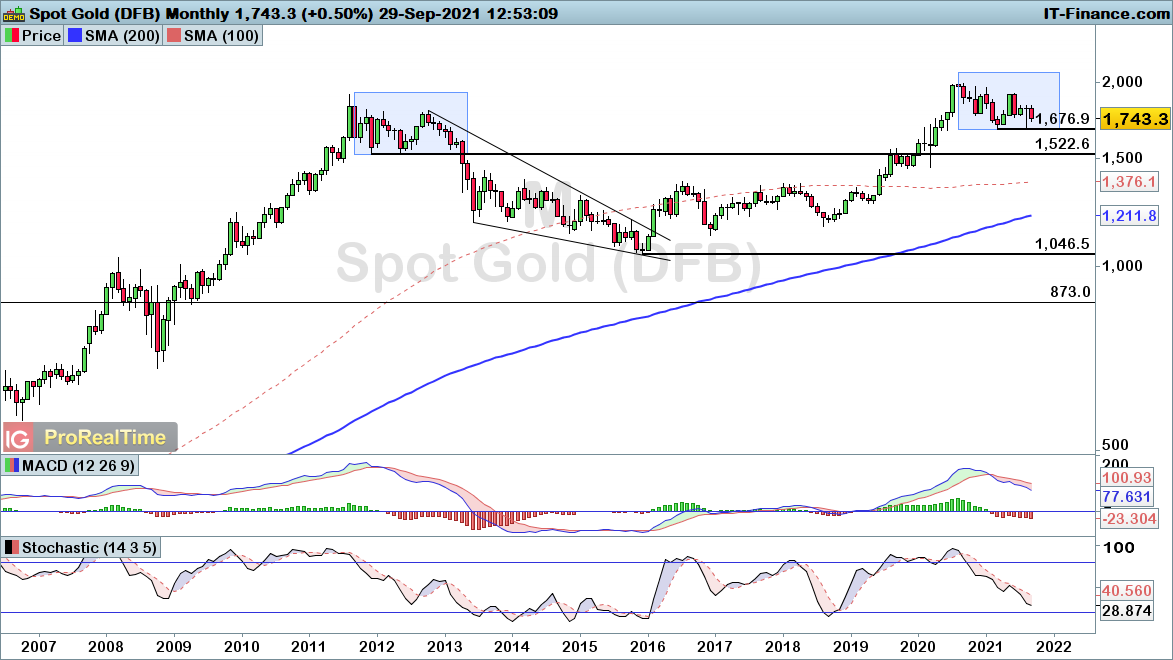 Source: ProRealTime
From a daily perspective, the recent rally failed to break through $1834 resistance. Instead we have seen price reverse lower over the course of this week.
This raises the possibility of us continuing the bearish trend seen in recent months. When yields start to ease back, gold is likely to find support. However, as long as the Fed remains steadfast over its monetary tightening plans, gold is likely to suffer.
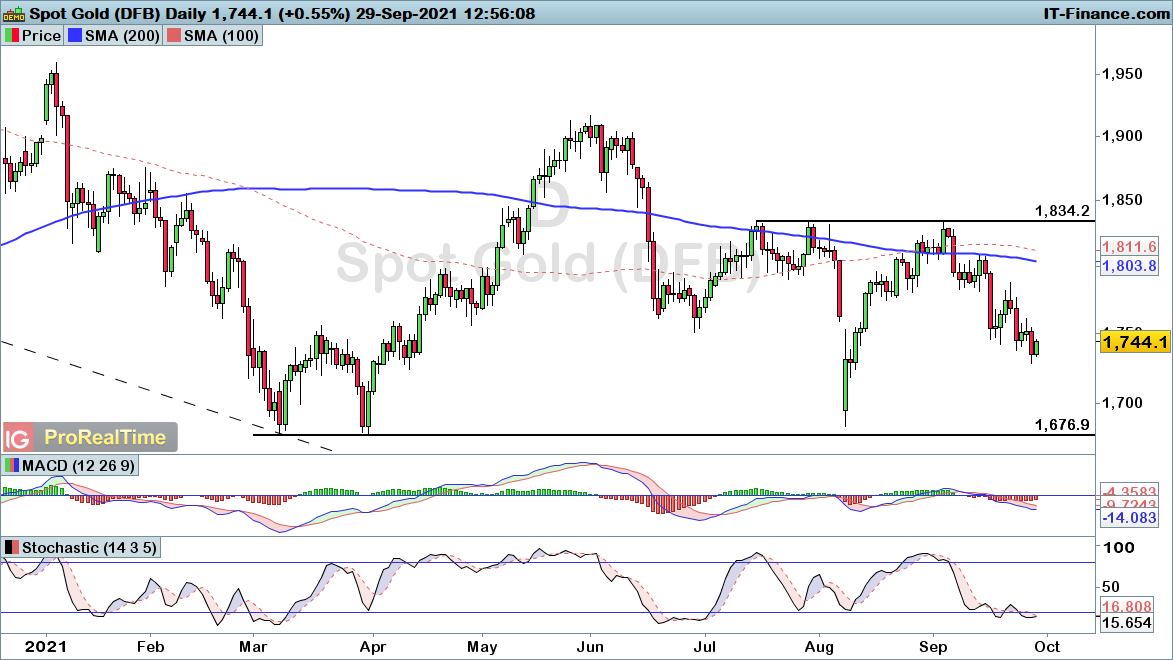 Source: ProRealTime


.jpeg.98f0cfe51803b4af23bc6b06b29ba6ff.jpeg)

0 Comments
Recommended Comments
There are no comments to display.
Create an account or sign in to comment
You need to be a member in order to leave a comment
Create an account
Sign up for a new account in our community. It's easy!
Register a new accountSign in
Already have an account? Sign in here.
Sign In Now