Jump to content

FTSE 100 Price Outlook: UK Stocks Well Placed to Advance Further


MongiIG

395 views

FTSE 100 PRICE, NEWS AND ANALYSIS:

  • The FTSE 100 index of leading London-listed stocks is in a good position to climb further, helped by Wall Street strength, risk-on sentiment in the markets, earnings optimism and news of an unexpected drop in UK inflation.
  • Those factors should outweigh continuing market expectations of an imminent tightening of UK monetary policy and bad Covid-19 data.

Top 5 Small-cap Stocks to Watch | IG UK


LONDON STOCKS UPSIDE BECKONS

London’s FTSE 100 index is modestly lower in early European trading Wednesday but it’s becoming increasingly clear that its trend higher remains in place, partly due to the strength of Wall Street stocks. The S&P 500 index closed in New York up 0.7% Tuesday, only just below its record high.

In addition, “risk on” sentiment continues to benefit assets like stocks and the latest UK inflation data were positive, showing unexpected declines in September. Earnings optimism could be a factor too.

UK INFLATION DATA

Latest UK inflation data.

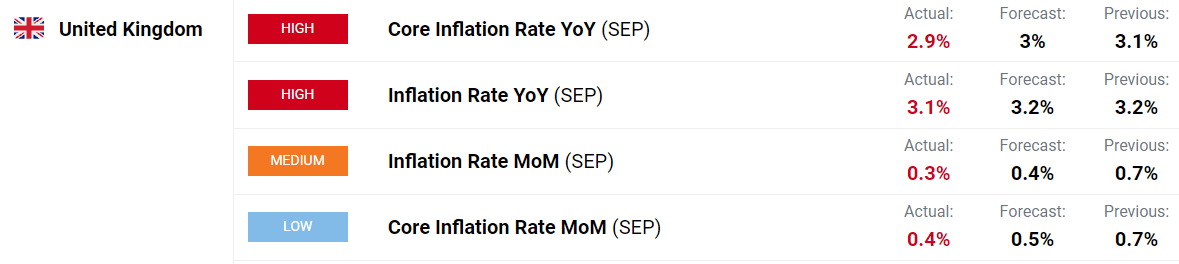
Source: DailyFX calendar

On the downside, the Bank of England is still expected to be one of the first major central banks to tighten monetary policy, with market pricing showing just a 7.8% chance that UK Bank Rate will still be at 0.25% by September next year. Moreover, the latest UK Covid-19 data show the figures are worsening.

Still, as the chart below shows, the FTSE continues to trend higher and remains within shouting distance of its highest level since February 2020, reached at the start of this week.

FTSE 100 PRICE CHART, DAILY TIMEFRAME (FEBRUARY 23 - OCTOBER 20, 2021)

Latest FTSE 100 price chart.

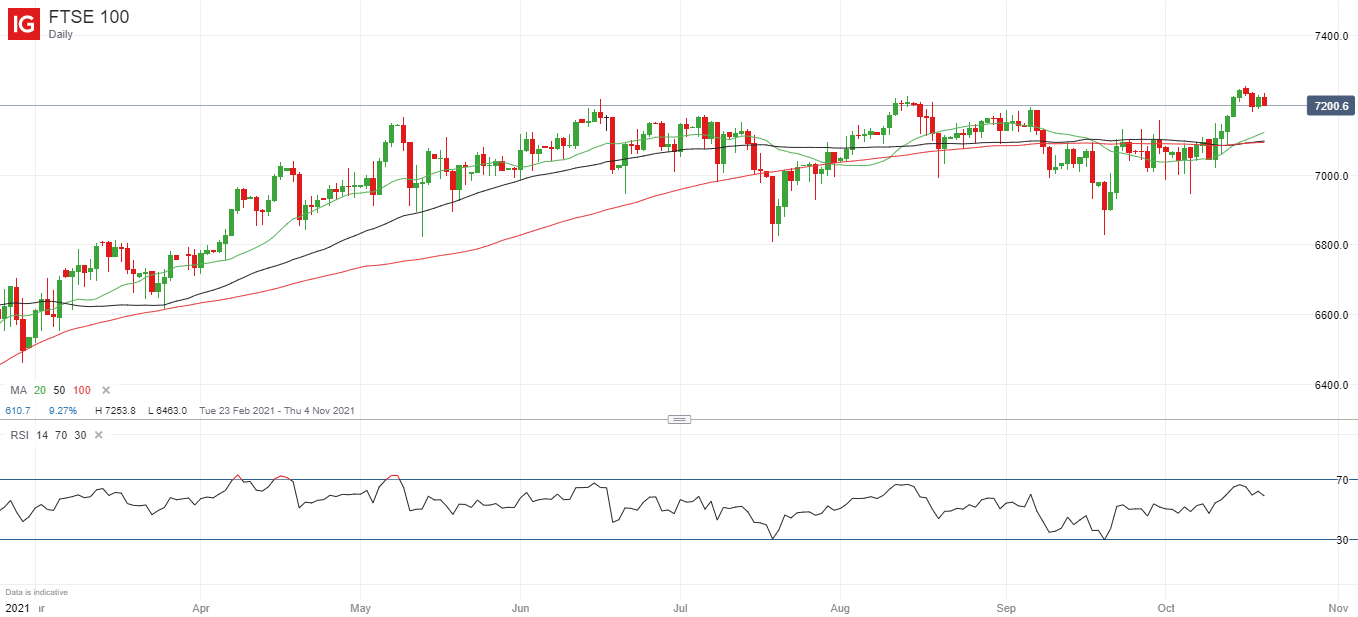
Source: IG (You can click on it for a larger image)


BULLISH SENTIMENT DATA

As for sentiment, IG client positioning data are sending a bullish signal. IG’s retail trader data show 34.81% of traders are net-long, with the ratio of traders short to long at 1.87 to 1. The number of traders net-long is 6.39% lower than yesterday and 22.16% lower than last week, while the number of traders net-short is 1.92% higher than yesterday and 25.95% higher than last week.

Here at DailyFX, we typically take a contrarian view to crowd sentiment, and the fact traders are net-short suggests FTSE 100 prices may continue to rise. Moreover, traders are further net-short than yesterday and last week, and the combination of current sentiment and recent changes gives us a stronger FTSE 100-bullish contrarian trading bias.


Written by Martin Essex, Analyst, 20th October 2021. DailyFX

0 Comments


Recommended Comments

There are no comments to display.

Create an account or sign in to comment

You need to be a member in order to leave a comment

Create an account

Sign up for a new account in our community. It's easy!

Register a new account

Sign in

Already have an account? Sign in here.

Sign In Now
  • Blog Statistics

    • Total Blogs
      3
    • Total Entries
      2,822
  • Latest Forum Topics

  • Our picks

    • International Workers' Day & Early May Trading Hours
      Please be advised that our opening hours will be adjusted on 1 May 2024 for International Workers’ Day and 6 May 2024 for the UK Early May Bank Holiday. Where appropriate, the times listed are in GMT.
        • Like
    • Are these the best AI stocks to watch in May 2024?
      Microsoft, Apple, Nvidia, Amazon and Meta could be the best AI stocks to watch next month. These stocks are the largest AI stocks in the US based on market capitalisation.
    • Natural Gas Commodity Elliottwave Technical Analysis
      Natural Gas


      Mode - Impulsive 


      Structure - Impulse Wave 


      Position - Wave (iii) of 5


      Direction - Wave (iii) of 5 still in play


      Details:  Price now in wave iii as it attempts to breach 1.65 wave i low. Wave (iii) is still expected to extend lower in an impulse.


      Natural Gas is currently breaching the previous April low, marking a decisive move as the impulse initiated on 5th March continues its downward trajectory, further extending the overarching impulse wave sequence that commenced back in August 2022. This decline is anticipated to persist as long as the price remains below the critical resistance level of 2.012.


      Zooming in on the daily chart, we observe the medium-term impulse wave originating from August 2022, which is persisting in its downward trend after completing its 4th wave - delineated as primary wave 4 in blue (circled) - at 3.666 in October 2023. Presently, the 5th wave, identified as primary blue wave 5, is underway, manifesting as an impulse at the intermediate degree in red. It is envisaged that the price will breach the February 2024 low of 1.533 as wave 5 of (3) seeks culmination before an anticipated rebound in wave (4). This confluence of price movements underscores the bearish sentiment prevailing over Natural Gas in the medium term.


      Analyzing the H4 chart, we initiated the impulse wave count for wave (3) from the level of 2.012, which marks the termination point of wave 4. Notably, price action formed a 1-2-1-2 structure, with confirmation established at 1.65 and invalidation set at 2.012. The confirmation of our anticipated direction materialized as price breached the 1.65 mark, signifying a resumption of bearish momentum. Presently, there appears to be minimal resistance hindering the bears, thereby reinstating their dominance in the market. It is projected that wave iii of (iii) of 5 will manifest around 1.43, indicative of the potential for the wave 5 low to extend to 1.3 or even lower. This comprehensive analysis underscores the prevailing bearish outlook for Natural Gas in the immediate future.


      Technical Analyst : Sanmi Adeagbo
       
        • Like
×
×
  • Create New...
us