Apple share price: Q4 earnings preview

Entry posted by MongiIG in Market News
1,214 views
Apple share price: Q4 earnings preview
Apple Q4 earnings to be driven by iPhone 12 sales.
 Source: Bloomberg
When are the Apple results?
Apple Inc. the world’s largest company by market capitalization, is set to report quarter four (Q4) 2021 earnings on 28 October 2021.
What ‘the Street’ expects from Apple Q4 2021 results?
Apple Inc. no longer issues forward guidance for its quarterly results due to the Covid-19 pandemic, its effects on supply chains and in turn the uncertainty of future earnings.
That being said, Apple has done very well through the Covid-19 pandemic period and has had a very strong year thus far. The follows on from the June quarter where revenue records were realized in each of the group’s geographic segments and double-digit growth was recorded in each of the group’s product categories.
iPhone 12 demand is expected to be the primary driver of revenue and earnings growth, while iPhone 13 sales will only have a material impact on the next reporting quarter (Q1 2022). Markets will be hoping that forward guidance from the group is reinstated with a particular focus on how chip shortages could effect sales going forward. For the reporting quarter however, iPhone sales are suggested by JP Morgan to be within the range of 55 to 58 million units, equating to around $46 billion in sales.
A consensus of estimates from Refinitiv data for the upcoming Q4 2021 Apple results arrive at the following:
- Revenue for the quarter of $84.8 billion
- Earnings per share (EPS) for the quarter of $1.23
How to trade Apple results
In terms of an institutional view as of 20 October 2021, a Refinitiv poll of 42 analysts have an average rating of ‘buy’ for Apple, with a long-term price target (mean) of $168.35.
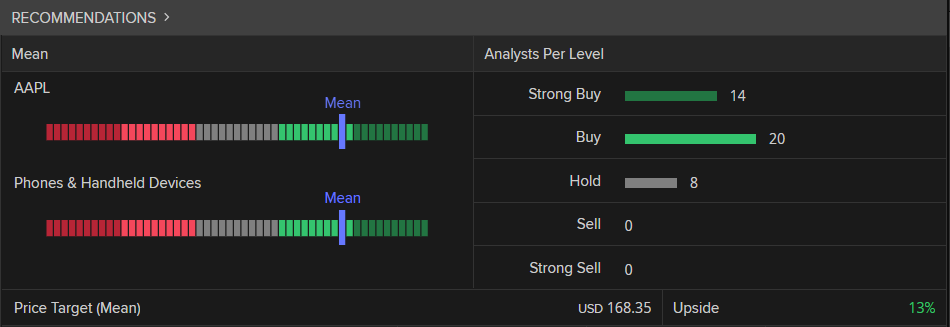 Source: Refinitiv
In terms of a retail trading view, as of 20 October 2021, IG Client Sentiment data shows 93% of IG clients with open positions expect the price to rise in the short term, while 7% expect the price to fall in the near term.
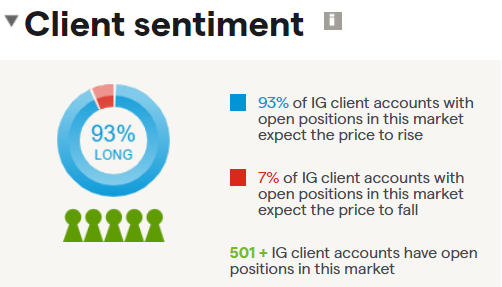 Source: IG
Apple share price – technical view
 Source: IG charts
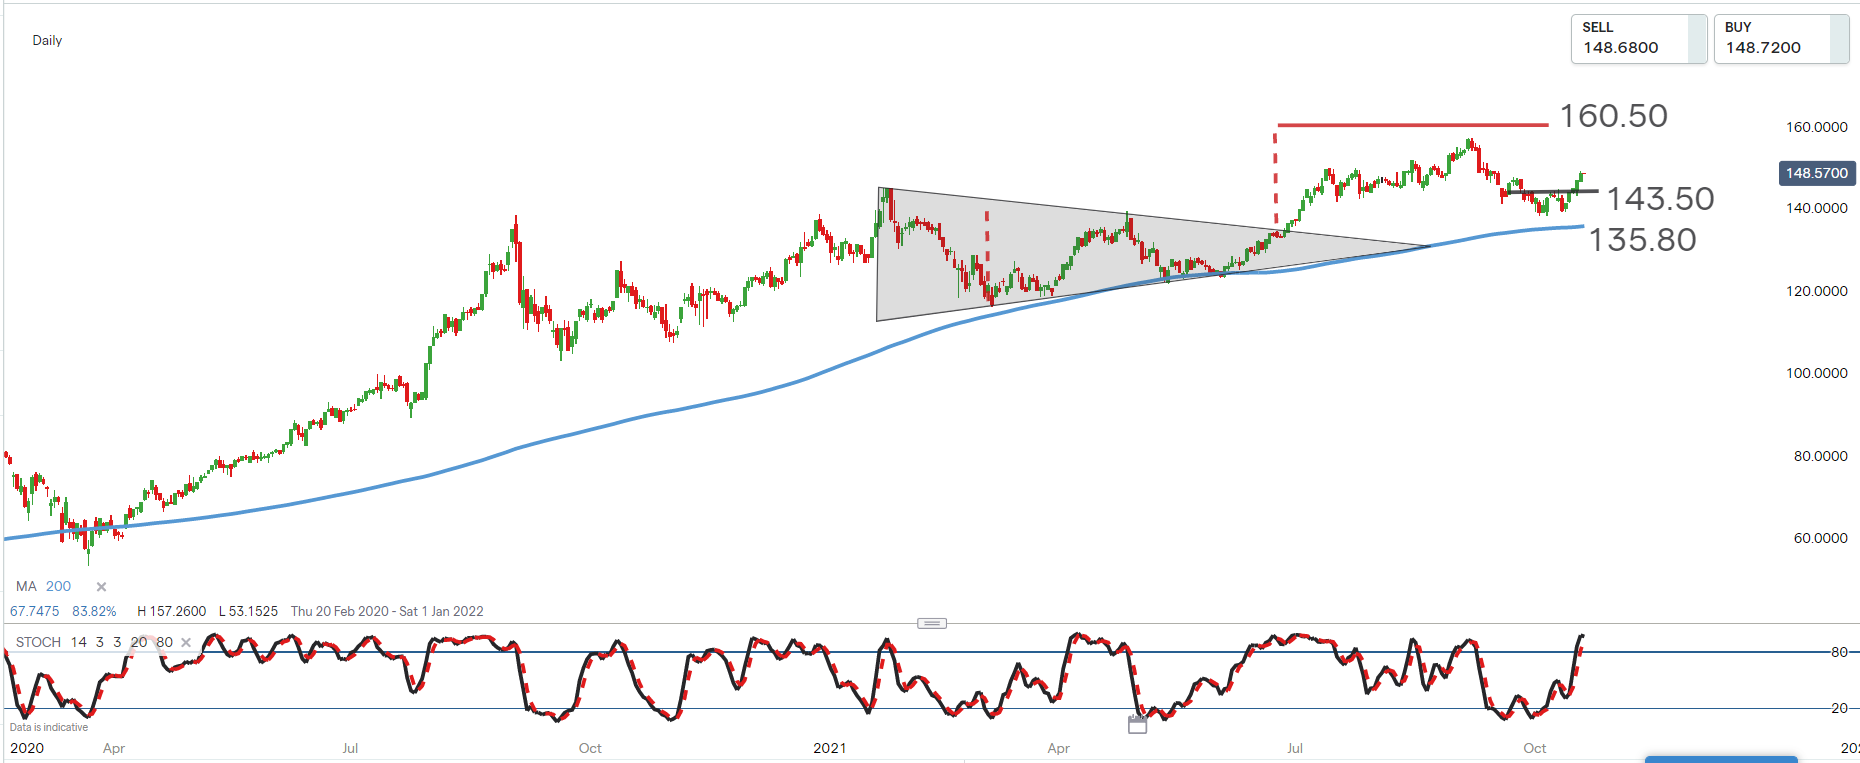
In our previous earnings preview note on Apple, we looked at the price breaking out of the bullish triangle formation. The move fell marginally short of the 160.50 projected target and the price has since retraced back to the 200 day simple moving average (SMA) displayed by the blue line.
The ‘w’ shape below the 143.50 level is known as a double bottom formation in technical analysis terms. In context this pattern suggests that the correction or downtrend since the recent price high for Apple is now over.
160.50 continues to be our favoured upside target as the short-term trend now resumes up in line with the longer-term uptrend. Only on a move below the 200 day SMA currently at 135.80 would we reassess the merits of our long bias to trades on Apple.
Summary
- Q3 2021 results are scheduled for 28 October 2021
- Revenue for the quarter of $84.8 billion expected
- EPS for the quarter of $1.23 expected
- The average long term broker rating consensus for Apple is ‘buy’
- 93% of IG clients with open positions on Apple expect the price to rise in the near term
- The long term trend for Apple remains up
- The short term uptrend for Apple has resumed


.jpeg.98f0cfe51803b4af23bc6b06b29ba6ff.jpeg)

0 Comments
Recommended Comments
There are no comments to display.
Create an account or sign in to comment
You need to be a member in order to leave a comment
Create an account
Sign up for a new account in our community. It's easy!
Register a new accountSign in
Already have an account? Sign in here.
Sign In Now