Disney’s share price: what to expect from Q3 results

Entry posted by ArvinIG in Analyst Article
1,151 views
Find out what to expect from Disney’s earnings results, how they will affect Disney share price, and how to trade Disney’s earnings.

Source: Bloomberg
When is Disney’s results date?
The entertainment and media conglomerate, Disney, is expected to release its figures for the third quarter (Q3) on Wednesday 10 November after market close.
Disney share price: forecasts from Q3 results
Earnings beat estimates easily last time around, and revenue was also above expectations even if by a smaller percentage. When it comes to streaming, subscriber figures and growth are a crucial component, 116 million last time around with expectations it’ll grow by only 'low single-digit millions' according to its chief executive officer (CEO) over a month ago. But even if it does manage to show more momentum on that front, more subscribers doesn’t always translate into higher proportional streaming revenue, with average revenue per user dropping in Q2 due to lower prices for its Hotstar subscribers.
A total of 174 million subscribers when putting Disney+, ESPN+, and Hulu together, and the company sees over a billion households globally as part of its addressable market. Its growth story is crucial, and any slowing would hand analysts that have placed it into the underweight category more fuel for their argument, with the bulk of its growth previously coming from markets with lower margins pulling its average revenue per user down.
There’s also been plenty of competition, and wooing the next tranche of users who may not have rushed might prove more difficult during a period of economic reopening and lockdown restrictions easing. Parks, experiences, and products might be back in profit according to the results last quarter, but attendance has been lighter and would weight on this aspect of financials, its parks alone not profitable in Q2 but should change as reopening gathers pace.
Disney is also planning to release more than 20 new content titles from and catered to Asia-Pacific, and is expanding Disney+ to premiere in more countries in the region. Thus far nothing giving the break and momentum we’ve seen from Netflix's Squid Game, the total costs of the entire season in some cases less than just one episode of some of Disney’s top tier shows.
Putting it all together, and expectations this time around are for an earnings per share (EPS) of $0.44, a bit lower than previous estimates and far less than its Q2 net result. As for revenue, $16.25 billion which is below both estimate and final Q2 readings. Analyst recommendations have moved quite a bit from what was clear majority buy back in August and September, with far more showcasing a hold though net still showing slight long bias (source: finance.yahoo.com).
Trading Disney’s Q3 results: weekly technical overview and trading strategies
From a technical standpoint, it hasn’t been looking very pretty as of late in both daily and weekly time frames, for the former prices near the lower end of the Bollinger Band, beneath all its key long-term moving averages, an average directional movement index (ADX) reading that’s moving higher, and a negative directional movement (DI-) still holding a healthy margin over the positive directional movement (DI+). It’s been mostly oscillatory sessions with any big breaks thus far eventually undone, and for an overall technical overview that’s consolidatory though suffering from short-term negative bias.
Even from a weekly standpoint that incorporates more long-term bias, its bullish run that levelled off near the top last March has been trapped in slow consolidatory moves since. But with much at stake with next week’s figures, prices could be in for a break past key levels, making it more breakout strategies vs. reversal, absent fundamental news and the levels may hold somewhat or average back towards these levels, while a fundamental shift amongst investors and traders to a new zone for its share price would translate into contrarian breakout strategies outperforming.
| Current technical overview | Consolidation - negative bias |
| Technical overview conformist strategies | Sell 1st resistance at/before price, buy 1st support after reversal |
| Technical overview contrarian strategies | Buy 1st resistance upon breakout from below, sell 1st support upon breakout from above |
| S/L for 2nd resistance | 183.43 |
| 2nd Resistance | 181.21 |
| S/L for 1st resistance | 179.00 |
| 1st Resistance | 176.78 |
| Relative starting point | 172.35 |
| 1st Support | 167.92 |
| S/L for 1st support | 165.71 |
| 2nd Support | 163.49 |
| S/L for 2nd support | 161.28 |
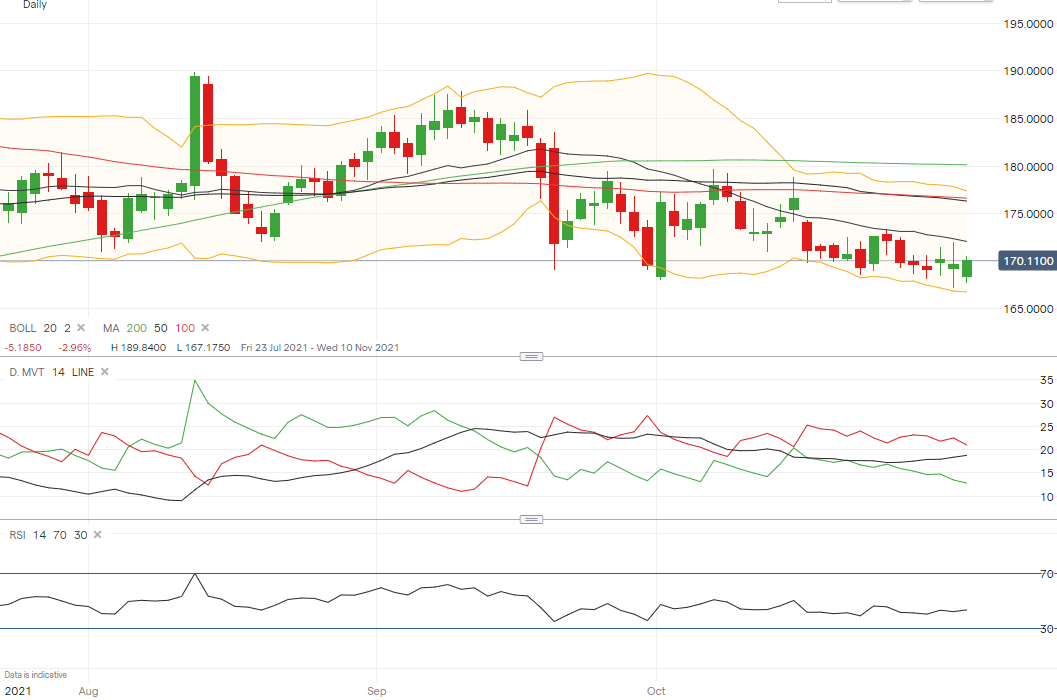
Source: IG charts
IG Client sentiment* and short interest for Disney shares
Retail trader bias is a consistent extreme buy bias for Disney, and has risen from 96% to 99% over the past couple of weeks, and if they’ve been holding this bias prior to its bull run from sub-$100 to nearly double those levels and would make them beneficiaries, that story far clearer when it comes to the FAANG stocks (or now MANGA following Facebook's name change).
Short interest is quite low with 24.56 million of shares shorted that has dropped slightly from its previous reading (according to shortsqueeze.com), out of a total 1.8 billion represents only 1.36%, and where based on daily volume wouldn’t take more than three days to cover.
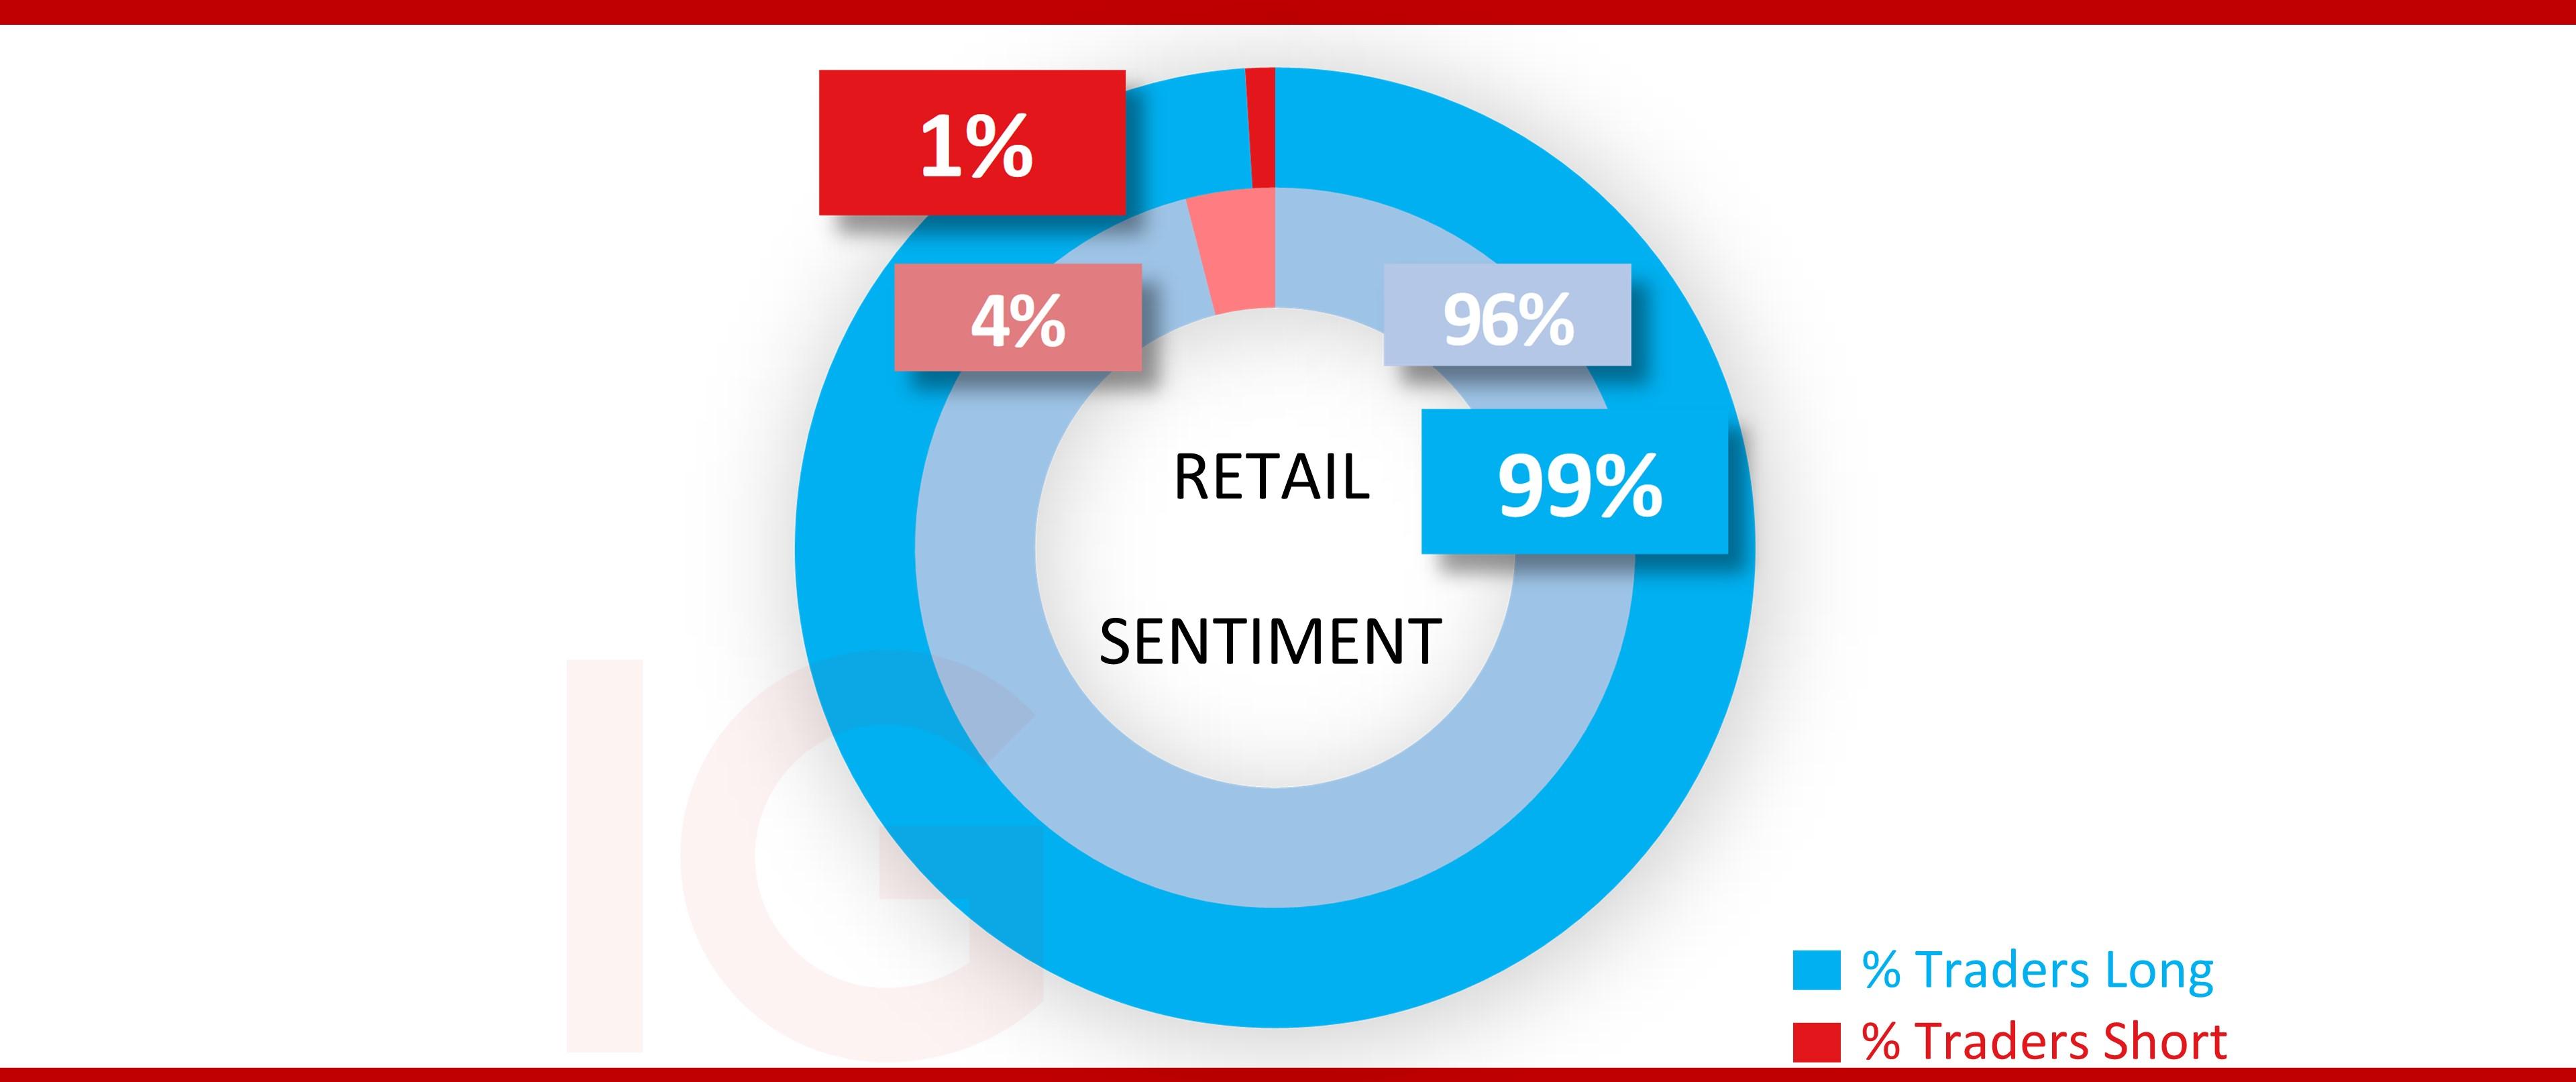
Source: IG charts
*The percentage of IG client accounts with positions in this market that are currently long or short. Calculated to the nearest 1%, as of today morning 8am for the outer circle. Inner circle is from the previous trading day.
Monte Safieddine | Market analyst, Dubai
06 November 2021


.jpeg.98f0cfe51803b4af23bc6b06b29ba6ff.jpeg)


0 Comments
Recommended Comments
There are no comments to display.
Create an account or sign in to comment
You need to be a member in order to leave a comment
Create an account
Sign up for a new account in our community. It's easy!
Register a new accountSign in
Already have an account? Sign in here.
Sign In Now