Jump to content

Lumber looks primed for another big Q4 surge


MongiIG

938 views

Lumber looks set for a bumper Q4, with seasonality charts signalling the potential for another big surge in price.

BG_LUMBER_361640647.jpgSource: Bloomberg
 Joshua Mahony | Senior Market Analyst, London | Publication date: Monday 22 November 2021 

Lumber prices on the rise, as fourth quarter rally looks to be taking shape

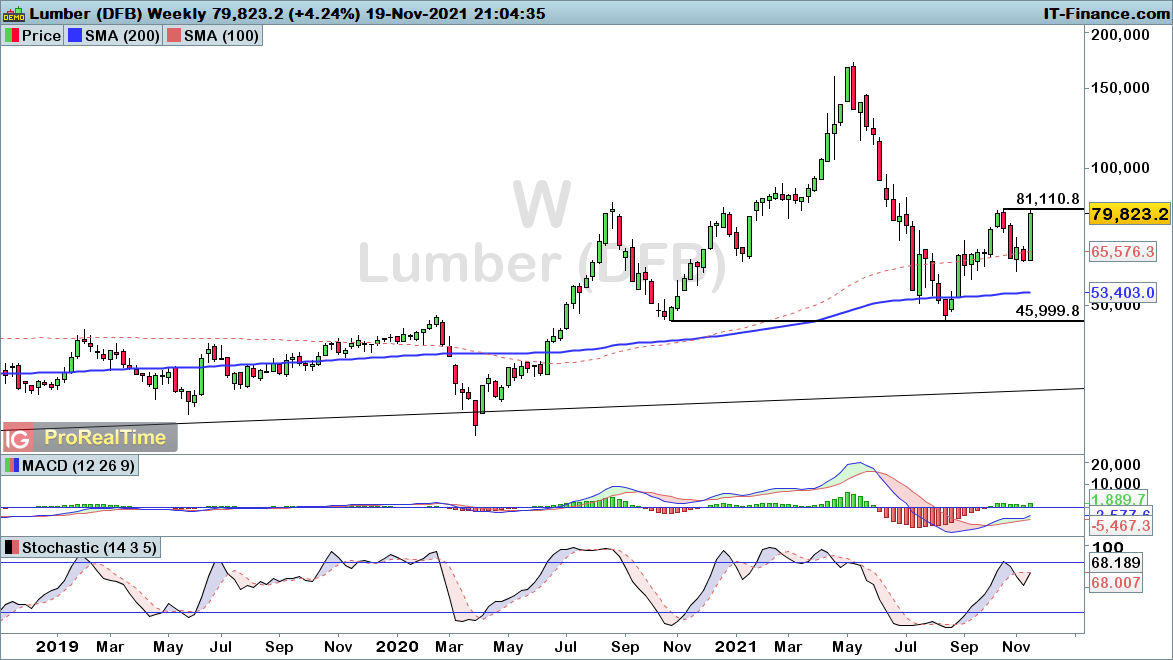
Lumber enjoyed a strong week just gone, with prices rising back towards the key $811 resistance level. From a wider perspective, we can see how the past three months have brought about an impressive 73% gain for this market.

LB-Weekly-2021_11_22-12h49.pngSource: ProRealTime


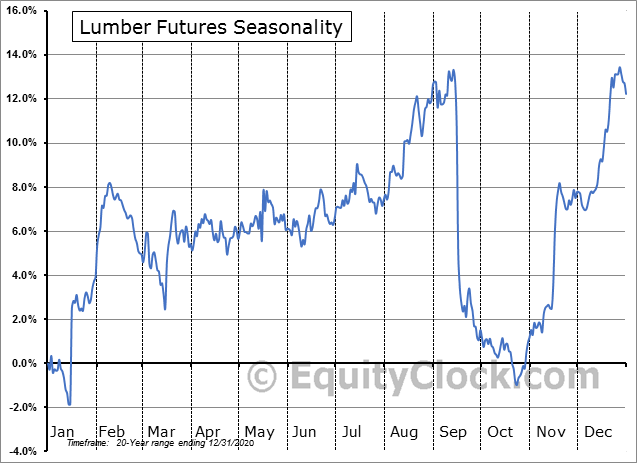
The seasonality chart highlights how this rally could pave the way for another big year-end recovery for lumber.

With price having slumped in May-August, we have seen price set up for a potential repeat of the average trajectory seen over the past 20-years. That chart points towards a particularly strong fourth quarter, with November and December providing major upside in the past.

Lumber_seasonality_221121.png


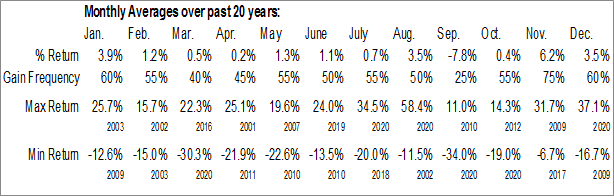
The finer details highlight how the 26% gains seen so far this month put us on track for yet another bumper November.

Thus far, we have seen a 75% hit rate for that month. Looking towards the December data, it is less reliable at 60%.

However, that does represent the joint second highest hit rate of any month (alongside January). That points towards November-January historically being the most reliable three-month period for Lumber.

LUMBER_SEASONS_BREAKDOWN_221121.pngSource: IG


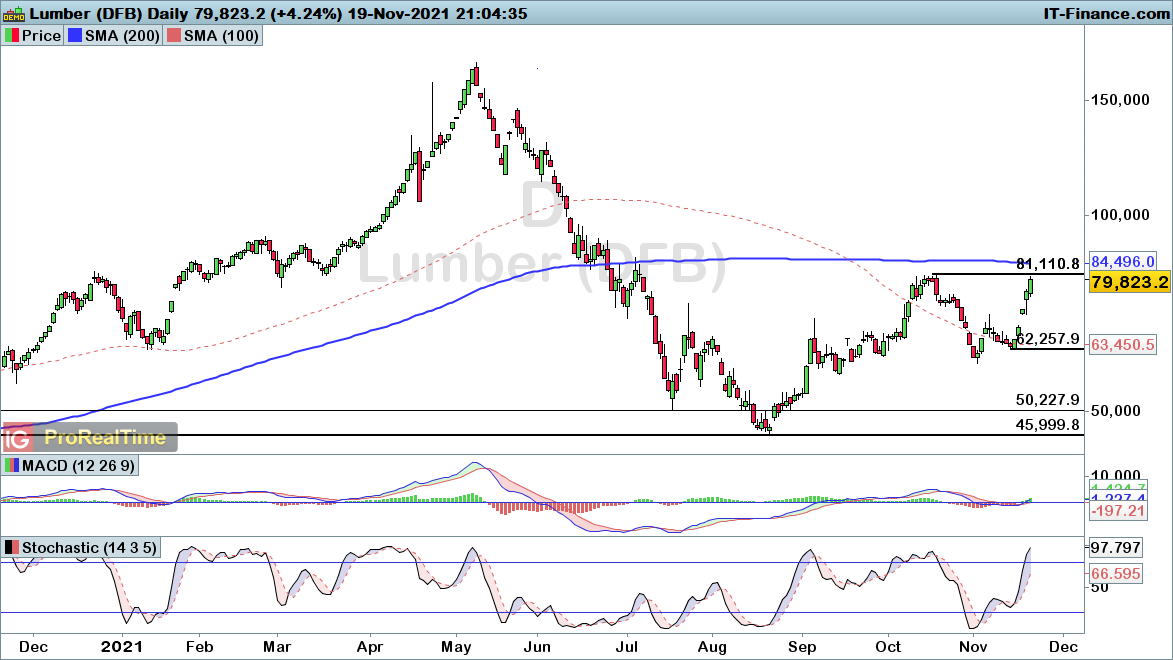
Coming back to price itself, we can see price rising back into the $811 resistance level, with a break through that level bringing about a fresh buy signal. A break back below the $622 level would be required to negate that bullish view.

LB-Daily-2021_11_22-13h04.pngSource: ProRealTime

0 Comments


Recommended Comments

There are no comments to display.

Create an account or sign in to comment

You need to be a member in order to leave a comment

Create an account

Sign up for a new account in our community. It's easy!

Register a new account

Sign in

Already have an account? Sign in here.

Sign In Now
  • Blog Statistics

    • Total Blogs
      3
    • Total Entries
      2,822
  • Latest Forum Topics

  • Our picks

    • International Workers' Day & Early May Trading Hours
      Please be advised that our opening hours will be adjusted on 1 May 2024 for International Workers’ Day and 6 May 2024 for the UK Early May Bank Holiday. Where appropriate, the times listed are in GMT.
        • Like
    • Are these the best AI stocks to watch in May 2024?
      Microsoft, Apple, Nvidia, Amazon and Meta could be the best AI stocks to watch next month. These stocks are the largest AI stocks in the US based on market capitalisation.
    • Natural Gas Commodity Elliottwave Technical Analysis
      Natural Gas


      Mode - Impulsive 


      Structure - Impulse Wave 


      Position - Wave (iii) of 5


      Direction - Wave (iii) of 5 still in play


      Details:  Price now in wave iii as it attempts to breach 1.65 wave i low. Wave (iii) is still expected to extend lower in an impulse.


      Natural Gas is currently breaching the previous April low, marking a decisive move as the impulse initiated on 5th March continues its downward trajectory, further extending the overarching impulse wave sequence that commenced back in August 2022. This decline is anticipated to persist as long as the price remains below the critical resistance level of 2.012.


      Zooming in on the daily chart, we observe the medium-term impulse wave originating from August 2022, which is persisting in its downward trend after completing its 4th wave - delineated as primary wave 4 in blue (circled) - at 3.666 in October 2023. Presently, the 5th wave, identified as primary blue wave 5, is underway, manifesting as an impulse at the intermediate degree in red. It is envisaged that the price will breach the February 2024 low of 1.533 as wave 5 of (3) seeks culmination before an anticipated rebound in wave (4). This confluence of price movements underscores the bearish sentiment prevailing over Natural Gas in the medium term.


      Analyzing the H4 chart, we initiated the impulse wave count for wave (3) from the level of 2.012, which marks the termination point of wave 4. Notably, price action formed a 1-2-1-2 structure, with confirmation established at 1.65 and invalidation set at 2.012. The confirmation of our anticipated direction materialized as price breached the 1.65 mark, signifying a resumption of bearish momentum. Presently, there appears to be minimal resistance hindering the bears, thereby reinstating their dominance in the market. It is projected that wave iii of (iii) of 5 will manifest around 1.43, indicative of the potential for the wave 5 low to extend to 1.3 or even lower. This comprehensive analysis underscores the prevailing bearish outlook for Natural Gas in the immediate future.


      Technical Analyst : Sanmi Adeagbo
       
        • Like
×
×
  • Create New...
us