Volatility of volatility and the FOMC meeting

Entry posted by MongiIG in Market News
1,495 views
Volatility has been fierce since the start of the year as market participants fear a hawkish Fed.
 Source: Bloomberg
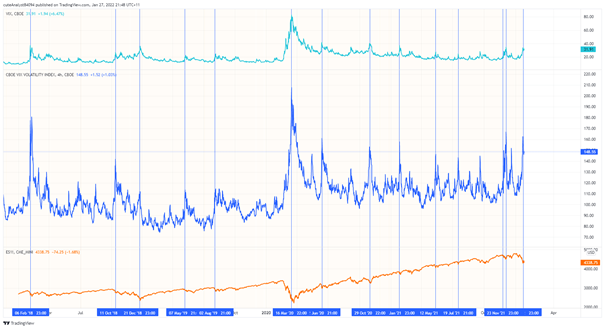
Volatility of volatility - VVIX - has been at extreme levels, and with uncertainty over the Fed’s future actions being reduced due to the FOMC meeting – is there any additional downside left?
Markets have sold off rather conspicuously since the beginning of the year due to heightened inflation fears as core inflation has exceeded 5% in the US and other markets.
At yesterday’s Federal Open Market Committee (FOMC) meeting, the Federal Reserve (Fed) agreed to an interest rate hike in March and to end the quantitative easing (QE) program the same month.
Since the Fed's last policy meeting in December, chair Jerome Powell said, "inflation has not gotten better. It has probably gotten a bit worse ... To the extent that the situation deteriorates further, our policy will have to reflect that."
"This is going to be a year in which we move steadily away from the very highly accommodative monetary policy we put in place to deal with the economic effects of the pandemic," he added.
The pace of tightening will be contingent on the inflation outlook. Broader market indices have seen elevated volatility, with the S&P 500’s VIX and VXN being over at >30 and volatility of volatility – VVIX - being close to 150.
 Source: TradingView
As the chart suggests, these volatile times often coincide with market bottoms.
According to a study, the FOMC meeting alleviates uncertainty as market participants are provided with new forward guidance by the Fed and revise their market outlook accordingly. This suggests that volatility should fall after meetings, and as such, equity markets should rise as they are inversely correlated.
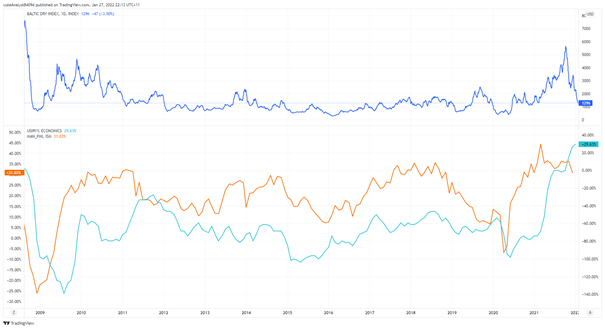
It is essential to not only look at inflation figures but also at periphery inflation indicators such as purchasing managers index (PMI) and the Baltic Dry Index.
 Source: TradingView
As the Baltic Dry Index measures the cost of freight of supersize ships, it is an excellent indicator to gauge global inflation.
The Baltic Dry index has peaked and is approaching levels seen before the onset of the Covid-19 pandemic. As such, we can infer that PMI in the US should follow suit, which inflation closely tracks.
Due to the time lag in correlation, inflation could begin to fall in the second or third quarter in the US. This would be in close line with the Fed’s overall narrative that inflation is transitory. While labour market conditions are tight in the US, as seen by unemployment reaching pre-pandemic lows, this suggests that wage inflation will grow.
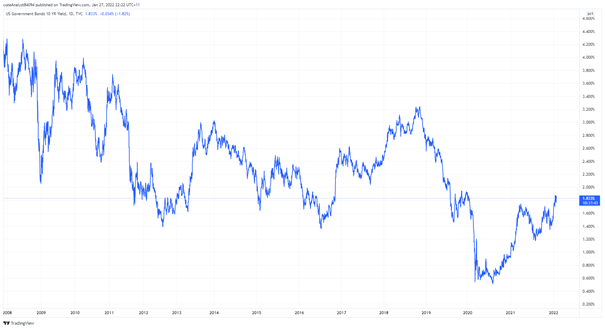
US 10-year yields have been hovering at levels >1.8, a healthy sign suggesting a recovery in credit markets.
 Source: TradingView
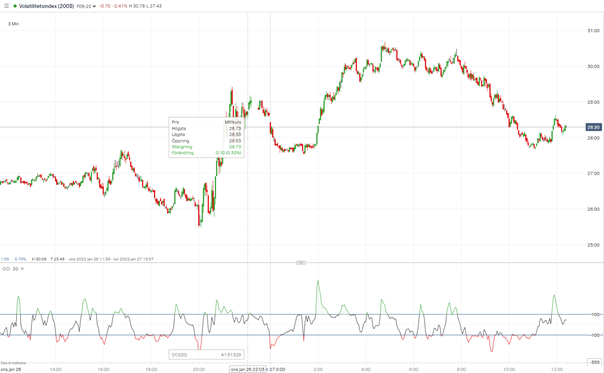
From a trading perspective, traders could short VIX futures or go long underlying equity indices as they are inversely correlated to the VIX.
IG offers exposure to VIX futures as well as a cash contract on it for traders wishing to conduct a mean-reverting volatility trade.
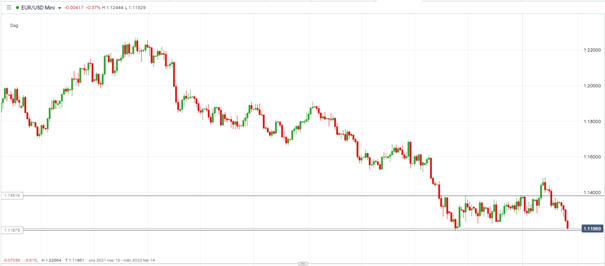
The US dollar index is likely to continue its ascent higher as the dollar strengthens at the prospect of higher interest rates.
Due to the divergence in monetary policy between the US and EU, the EUR/USD could head lower due to the increased appeal of the carry-trade. The EUR/USD has begun testing the lows of its daily trading range.
 Source: ProRealTime
Given the geopolitical turmoil in Eastern Europe, this could increase downward pressure on the EUR/USD if it escalates further as a flight to safety occurs.
 Source: ProRealTime


.jpeg.98f0cfe51803b4af23bc6b06b29ba6ff.jpeg)

2 Comments
Recommended Comments
Create an account or sign in to comment
You need to be a member in order to leave a comment
Create an account
Sign up for a new account in our community. It's easy!
Register a new accountSign in
Already have an account? Sign in here.
Sign In Now