Dow Jones rebound may lift Hang Seng Index and crude oil fall

Entry posted by ArvinIG in Analyst article
529 views
Chinese ADRs listed on US exchanges rebounded, setting a positive tone for Hong Kong market at open; falling crude oil prices alleviated inflation concerns and the FOMC meeting will be closely watched by traders.
Source: Bloomberg
Dow Jones, Hang Seng Index, crude oil, FOMC meeting, Asia-Pacific at open
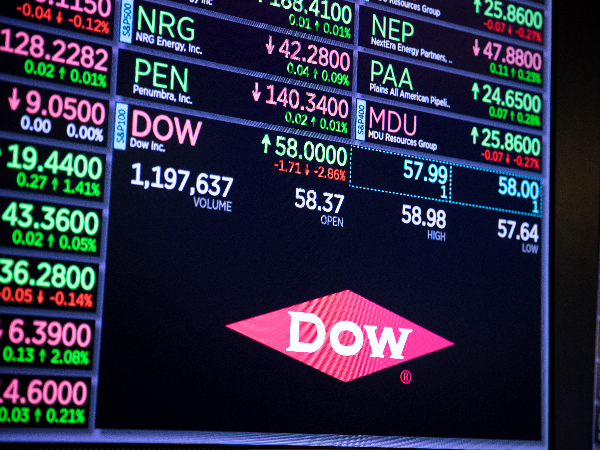
The Dow Jones Industrial Average rebounded 1.82% and the tech-heavy Nasdaq 100 surged 3.16% on Tuesday. Falling crude oil prices alleviated inflation fears and boosted investor confidence. WTI tumbled 23.7% over the last five trading sessions as tensions in Ukraine eased and China imposed lockdowns in a few key cities to combat the viral resurgence. The FOMC meeting will be closely scrutinized by investors around the globe today for clues about the Fed’s tightening roadmap amid heightened geopolitical risks and stagflation concerns. The central bank is expected to raise interest rate by 25bps at today’s meeting.
Hong Kong’s Hang Seng Index may rebound after falling nearly 6% a day ago amid intensified selloff in the technology sector. Fears about delisting from the US exchanges weighed on Chinese ADRs, pulling their Hong Kong counterparts sharply lower. Meanwhile, a severe viral resurgence dampened growth prospects in the world’s second-largest economy. Beijing imposed lockdowns in a few key commercial hubs including Shenzhen – China’s Silicon Valley – in an attempt to contain the rapid spread of the Covid-19 virus. This may cause global supply chain disruptions and send shockwaves to other countries.
JP Morgan Chase downgraded 28 Chinese internet stocks including Alibaba, Tencent and Meituan to underweight, calling them 'uninvestable' over the next 6 to 12 months due to rising geopolitical and macro risks. The Hang Seng Index has entered a bear market after falling 25% from February’s high. Trading at 6.7 times price-to-earnings (P/E), the index may entice long-term investors to jump in for bargain hunting opportunities.
Tencent - daily
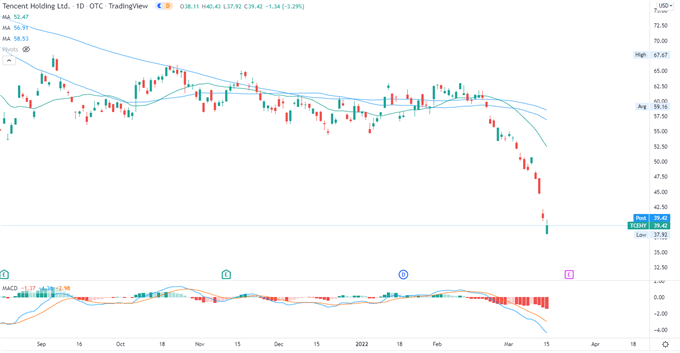
Source: TradingView
Asia-Pacific markets look set to trade higher following a positive lead on Wall Street. Futures in Japan, Australia, Hong Kong, Taiwan, Singapore, Malaysia, India and Indonesia are in the green, whereas those in mainland China, South Korea and Thailand are in the red.
Looking ahead, Canada’s inflation rate dominates the economic docket alongside US retail sales figures and the Fed interest rate decision. US retail sales is expected to come in at 0.4% on Month, falling from previous month’s reading of 3.8%.
Looking back to Tuesday’s close, 7 out of 9 Dow Jones sectors ended higher, with 93.3% of the index’s constituents closing in the green. Communication services (+2.99%), consumer discretionary (+2.78%) and information technology (+2.63%) were among the best performers, whereas energy (-5.06%) and materials (-2.34%) trailed behind.
Dow Jones sector performance 15 March 2022
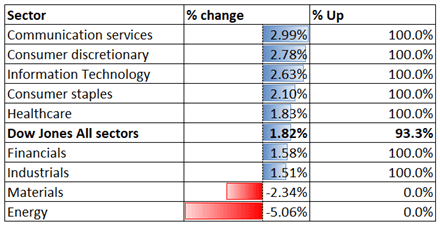
Source: DailyFX
Dow Jones technical analysis
The Dow Jones index may have formed a 'Double Bottom' chart pattern as highlighted on the chart below. This suggests that prices may have reached a near-term bottom and may embrace a technical rebound. Holding above a key support level of 32,940 may pave the way for further upside potential with an eye on 34,040. The overall trend remains bearish biased however, as price formed consecutive lower highs and lower lows over the past few months.
Dow Jones index – daily chart
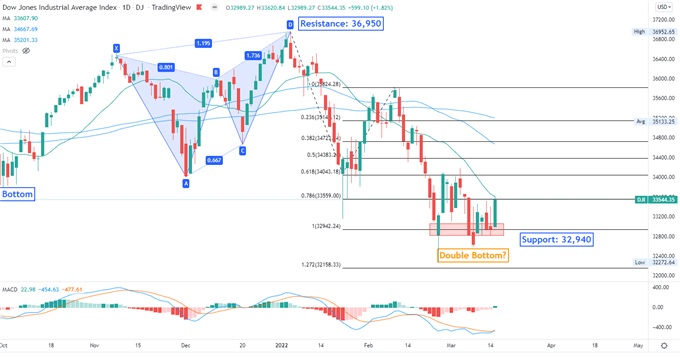
Source: TradingView
Hang Seng Index technical analysis
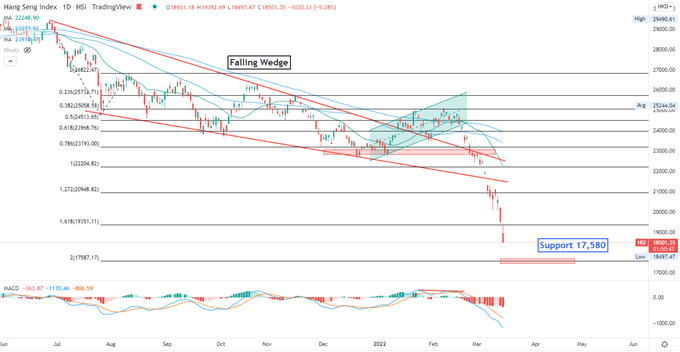
The Hang Seng Index (HSI) breached below multiple support levels and extended lower, underscoring strong selling momentum. An immediate support level can be found at 17,580 – the 200% Fibonacci extension. Holding above this level may pave the way for a technical rebound. The MACD indicator dove deeply into negative territory, suggesting that prices may be severely oversold.
Hang Seng Index – daily chart
Source: TradingView
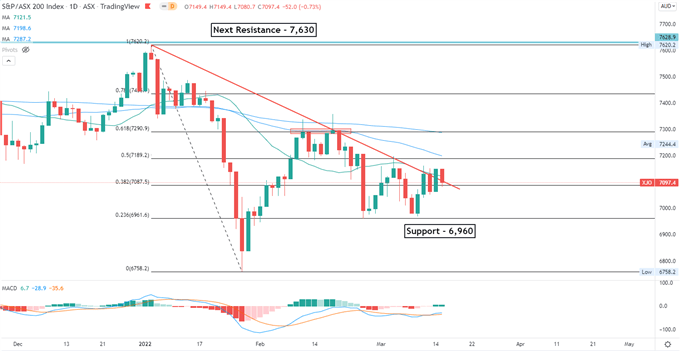
ASX 200 index technical analysis
The ASX 200 index is attempting to breach above the trendline resistance as shown on the chart below. A successful attempt may open the door for further upside potential with an eye on 7190, and then 7290. A reversal lower may intensify near-term selling pressure and bring an immediate support level of 6960 into focus. The MACD indicator is trending higher beneath the neutral midpoint, suggesting that bullish momentum may be building.
ASX 200 index – daily chart
Source: TradingView
Follow Margaret Yang on Twitter @margaretyjy
This information has been prepared by DailyFX, the partner site of IG offering leading forex news and analysis. This information Advice given in this article is general in nature and is not intended to influence any person’s decisions about investing or financial products.
The material on this page does not contain a record of IG’s trading prices, or an offer of, or solicitation for, a transaction in any financial instrument. IG accepts no responsibility for any use that may be made of these comments and for any consequences that result. No representation or warranty is given as to the accuracy or completeness of this information. Consequently, any person acting on it does so entirely at their own risk.
Margaret Yang | Strategist, DailyFX, Singapore
16 March 2022


0 Comments
Recommended Comments
There are no comments to display.
Create an account or sign in to comment
You need to be a member in order to leave a comment
Create an account
Sign up for a new account in our community. It's easy!
Register a new accountSign in
Already have an account? Sign in here.
Sign In Now