Coinbase Q1 earnings: what to watch after prices reach all-time low?

Entry posted by ArvinIG in Analyst article
560 views
Coinbase is currently trading at a super-discounted P/E ratio of only 8.6, compared to 150 times one year ago. Will the upcoming Q1 earnings overturn the momentum or keep pushing the price lower?

Source: Bloomberg
When is the report date?
Coinbase Global Inc (All Sessions) is estimated to report its earnings on May 10, 2022, after market close.
What to expect?
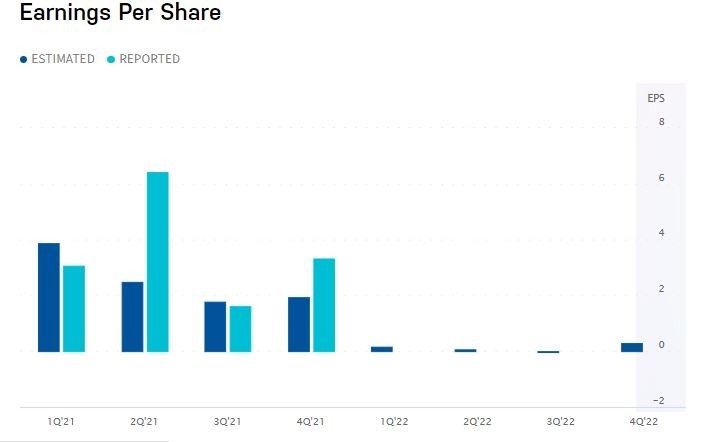
Based on six analyst forecasts at the Zacks Investment Research, the consensus EPS forecast for the quarter is $0.74. The reported EPS for the same quarter last year was $3.05.
Source: Nasdaq
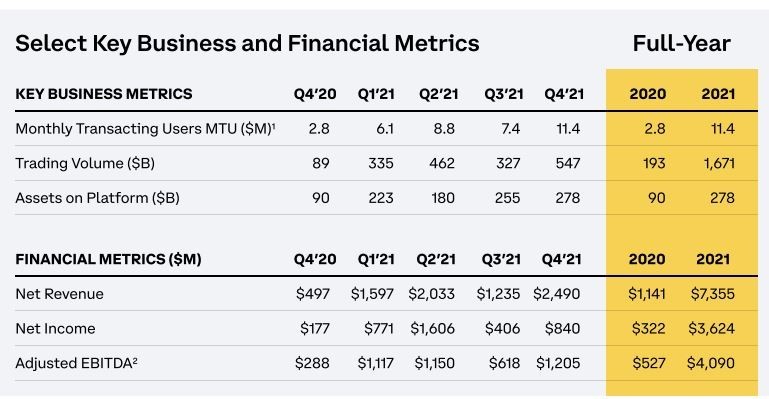
2021 was a year of tremendous growth and development for Coinbase. Both the number of its users and total revenue grew at a jaw-dropping 500% plus rate. In addition, the strong performance across Coinbase’s key metrics has seen its net income turn ten-fold. Overall, Coinbase Global is a very profitable business by all measures.
Source: Coinbase
Rolling into 2022, the company is expecting its trading volume to decline substantially to 200 billion USD, given that the crypto market capitalization is down by 20%. Coinbase also sees a lower number of retail MTUs at roughly 10 million down from the 11.4 million in Q4. A similar pattern is anticipated to be shown in the revenues from subscriptions and services.
On the expense side, increased miner expenses will be a crucial factor in driving up the cost due to the network congestion and elevated account verification expense.
What to watch?
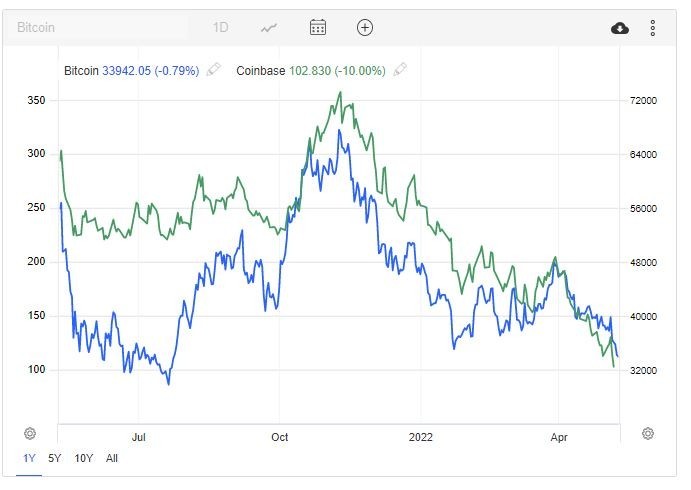
Overall, the leading crypto trading platform is foreseeing a challenging time ahead which has been reflected in its stock price. Coinbase's share price sits at its all-time-low level near $103 after dropping 70% from its all-time high six months ago. Coinbase is currently trading at a super-discounted P/E ratio of only 8.6, compared to 150 times one year ago.
However, putting aside the performance in the stock market, there is more to watch for the business.
The global crypto economy is still at its infancy stage and thus facing the strong headwind as it faces the global macroeconomic challenge, rising interest rates, inflation, and geopolitical instability - all of which deteriorates the appetite for risk. However, looking through the current haze, a company like Coinbase is likely to be a major beneficiary of the industry's explosive growth once the headwind fades.
Moreover, the company's diverse front-edge products will add tremendous value to the business when its time comes. For example, Coinbase is now officially the biggest NFT platform, an industry that is expected to grow 30.72% year by year. Therefore, the NFT platform could add more than $45 billion to Coinbase's market capitalization, and as of now, it is not priced in yet. Besides Coinbase Ventures, FairX, Coinbase One, and Coinbase Cloud are all waiting in the pipeline to shine.
Technical Analysis
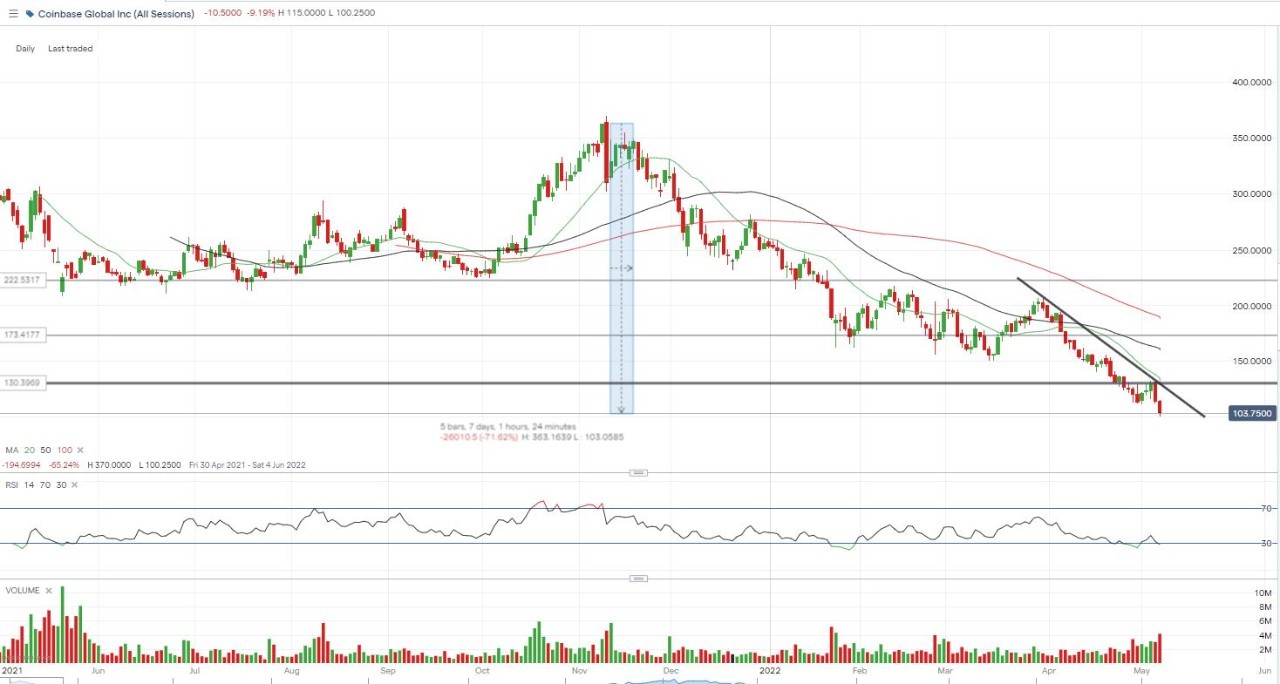
There’s little doubt that the share price of Coinbase still bears the risk of moving downwards in the near term. Looking at the daily chart, we can see that the price dropped so violently from April to follow the path of Bitcoin.
Source: TradingEconomics
With the price tumbled to its floor level, the technical will take a back seat to forecast how much lower it can be. While on the flip side, a retest of the $130 may help restore some confidence, but the descending trend line on the daily chart will exercise its resistance for such a move.
Source: TradingView
Take your position on over 13,000 local and international shares via CFDs or share trading – and trade it all seamlessly from the one account. Learn more about share CFDs or shares trading with us, or open an account to get started today.
Hebe Chen | Market Analyst, Australia
09 May 2022


.jpeg.98f0cfe51803b4af23bc6b06b29ba6ff.jpeg)


0 Comments
Recommended Comments
There are no comments to display.
Create an account or sign in to comment
You need to be a member in order to leave a comment
Create an account
Sign up for a new account in our community. It's easy!
Register a new accountSign in
Already have an account? Sign in here.
Sign In Now