Bank of Japan (BoJ) preview: increased pressure to challenge the central bank’s status quo

Entry posted by MongiIG in Market News
706 views
The BoJ is set to hold their monetary meeting across 16 – 17 June 2022, with the central bank expected to remain an outlier among other global central banks in monetary policies.
 Source: Bloomberg
BoJ to remain as the outlier among major central banks in tightening
Despite global central banks shifting towards a tightening stance, the Bank of Japan (BoJ) is expected to remain as the outlier. Current expectations are for the central bank to keep its current policy settings unchanged, which will include maintaining its target of -0.1% for short-term rates and the upper limit of 0.25% for its 10-year bond yield. This falls under its current policy of negative interest rate policy (NIRP) and yield curve control (YCC). That said, the recent up-move in US Treasury yields to reprice for an aggressive Federal Reserve (Fed) tightening has translated into immense selling for Japan’s 10-year government bonds (JGBs) as the BoJ is facing increased pressure from speculators who seek to challenge the central bank’s status-quo – potentially expecting an upward revision in long-term interest rate. While the likely scenario may still point towards the BoJ defending its bond’s ceiling by conducting unlimited bond purchases, anxiety is clearly running high with the upcoming BoJ meeting being looked upon for any reassurances of a no-change in policies.
Overnight, the Fed’s interest rate decision brought about a 75 basis-point (bp) hike, the largest increase since 1994 while the July’s Fed meeting is likely to see another selection between a 50 bp and 75 bp hike. These outsized rate hikes from the Fed may continue to widen the policy gap with the BoJ at a time when the Japanese yen is currently trading at its lowest level in 23 years. For now, it may be argued that the benefits of ultra-loose monetary stance to lift growth may outweigh the implications of a weaker yen on the economy but it seems like a matter of time where the BoJ may be forced to tweak its YCC policy or any foreign exchange intervention has to come into play. Intervention may potentially include moves to sell dollar and buy yen such as in the 1990s, but unless there is concrete action taking place, jawboning may have little effect in reversing the dollar-yen upward trend.
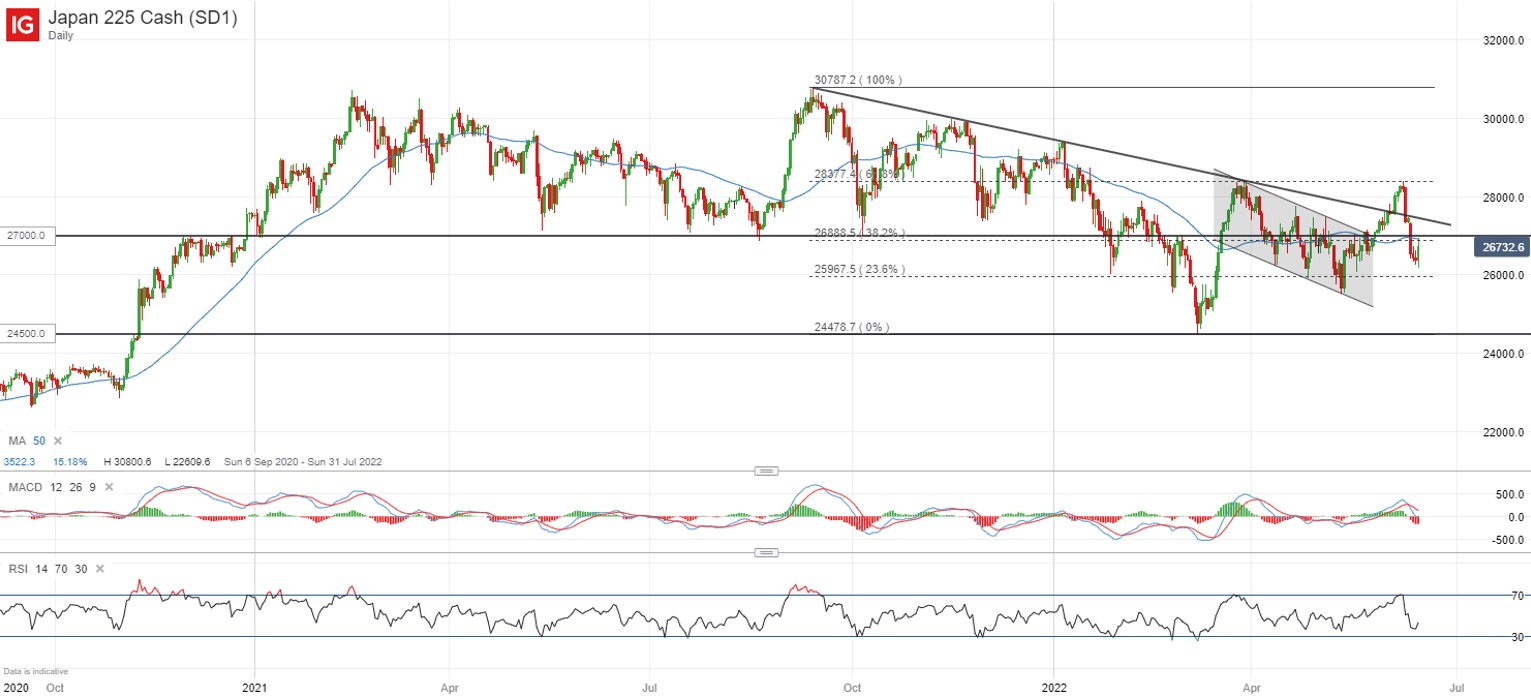
Japan 225: Upward trendline break proved to be short-lived
Seemingly as a sign of optimism, the Japan 225 index has previously broken above a key downward trendline, which has served as resistance for the index on four occasions since September last year. That said, the rally has proven to be short-lived as global risk sentiments took a sour turn, with the index failing to progress beyond a key 61.8% Fibonacci retracement level. The long bearish candlestick bodies which followed shortly after, may provide strong testament to the strong presence of sellers with a bearish crossover on the moving average convergence divergence (MACD) indicator. While there may be some improvement in risk sentiments post-Fed meeting, it is coming into resistance at the 27,000 level, where the confluence of a key 38.2% Fibonacci retracement level and the 50-day moving average (MA) seem to stand in the way. Any retracement may leave the 26,000 level of support on watch ahead, where a key 23.6% Fibonacci retracement level resides.
 Source: IG charts
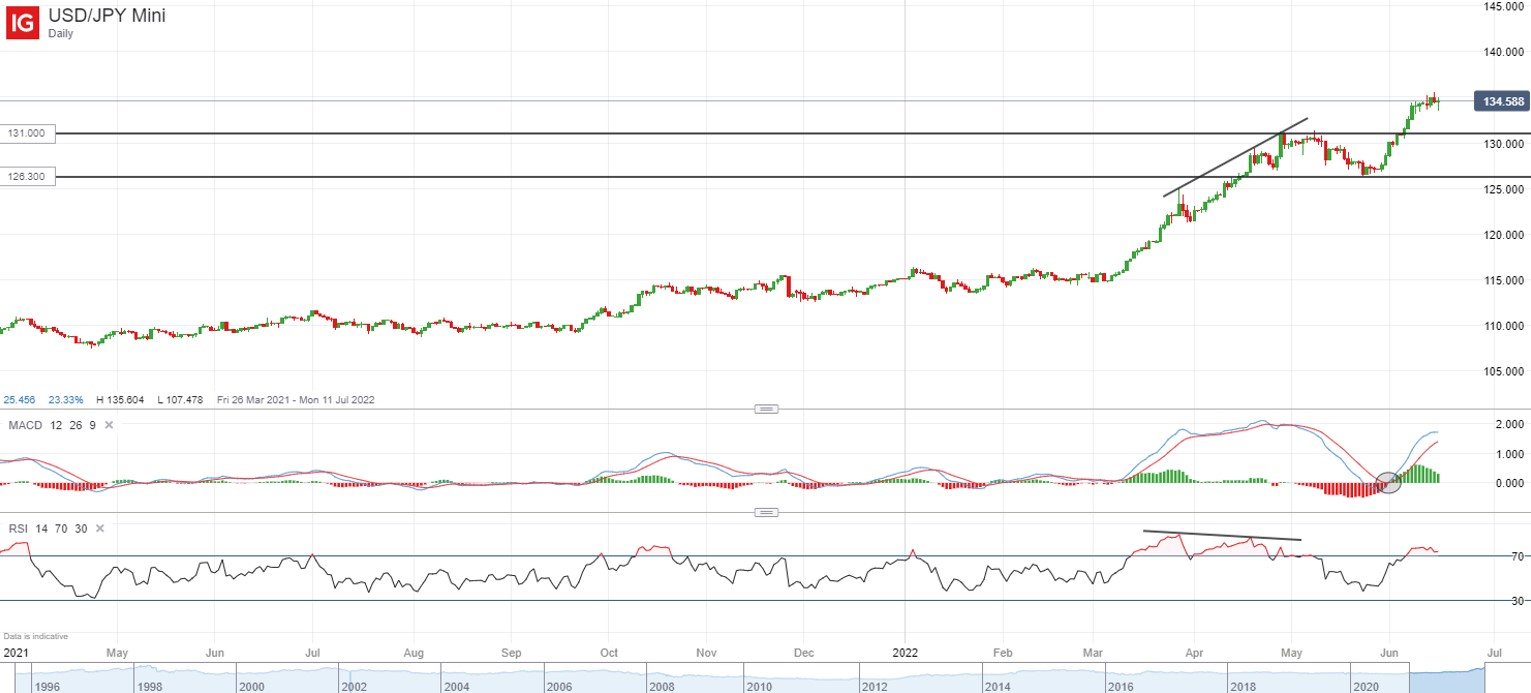
USD/JPY: Policy divergence remains as key tailwind
With the BoJ commitment to take on an opposite path from the US’ tightening stance, the widening bond yield differentials from policy divergence remains as the key factor driving USD/JPY to reach its highest level since 1998. After a temporary breather, the US Treasury yields seem to be coming into strength once again, which could provide tailwind for the currency pair if the BoJ maintains no-change at the upcoming meeting. The higher highs and higher lows suggest an ongoing upward bias, with previous retracement proving to be short-lived.
 Source: IG charts


.jpeg.98f0cfe51803b4af23bc6b06b29ba6ff.jpeg)

0 Comments
Recommended Comments
There are no comments to display.
Create an account or sign in to comment
You need to be a member in order to leave a comment
Create an account
Sign up for a new account in our community. It's easy!
Register a new accountSign in
Already have an account? Sign in here.
Sign In Now