US markets looking for some relief after recent sell-off: S&P 500, STI, AUD/NZD

Entry posted by MongiIG in Market News
1,099 views
The below-average volume during the shortened trading week saw the US futures moving higher, driving some expectations of a near-term reprieve following the recent weeks of sell-off.
 Source: Bloomberg
Market Recap
The below-average volume during the shortened trading week saw the US futures moving higher, driving some expectations of a near-term reprieve following the recent weeks of sell-off. That said, we will be getting greater cues of overall risk sentiments today with the US markets back online, as an uptick in US 10-year Treasury yields this morning seems to drive some wait-and-see for US equity futures.
Amid the quiet economic calendar to start the week, a series of comments from central bank speakers took centre stage yesterday. European Central Bank (ECB) President Christine Lagarde reaffirmed the central bank’s tightening intention to curb inflation, pointing to rate hikes in July and September. This may be nothing new, considering that prior guidance has been given, but the 25 basis-point hike guided for July seems to be less hawkish compared to what markets are pricing. This came with some downplaying of recession fears by Fed member James Bullard, pointing to continued growth in the US economy over the coming months. Those comments have done little in denting risk sentiments for now. Ahead, economic data releases tonight will include US existing home sales, along with the Chicago Fed National Activity Index, both to provide fresh updates on economic conditions amid recent Fed’s tightening.
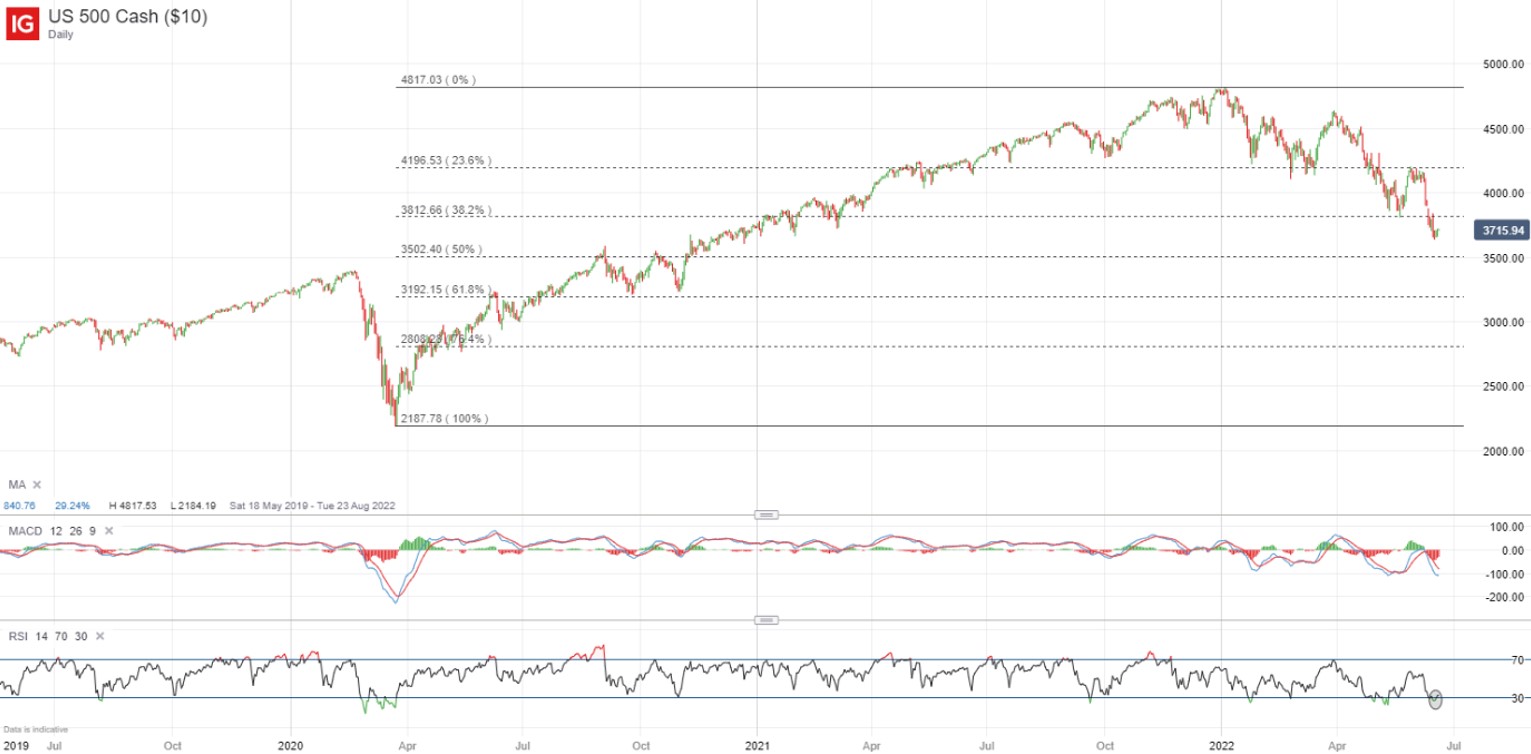
For the S&P 500, the sharp sell-off of 12.7% over the past two weeks has brought the relative strength index (RSI) into oversold territory. Any upside may leave the 3,812 level on watch, which marks a previous support-turned resistance. That said, the longer-term trend remains downward-bias, with the formation of a new lower low last week and the view remains that any upside may seem to be a relief rally for another potential leg lower.
 Source: IG charts
Asia Open
Asian stocks look set for a positive open, with Nikkei +1.34%, ASX +0.73% and KOSPI +0.59% at the time of writing. Coming after the heavy sell-off yesterday, today’s gains are attempting to pare back on previous losses, suggesting the presence of dip-buyers to drive a near-term reprieve. The day ahead will bring focus to the release of the Reserve Bank of Australia (RBA) minutes and with markets being highly sensitive to any hints of central banks’ tightening outlook, the minutes may be closely watched to lead sentiments in the early Asia session. Justification for the RBA’s recent surprise 50 basis-point hike will be sought, with some potential lean towards the hawkish end.
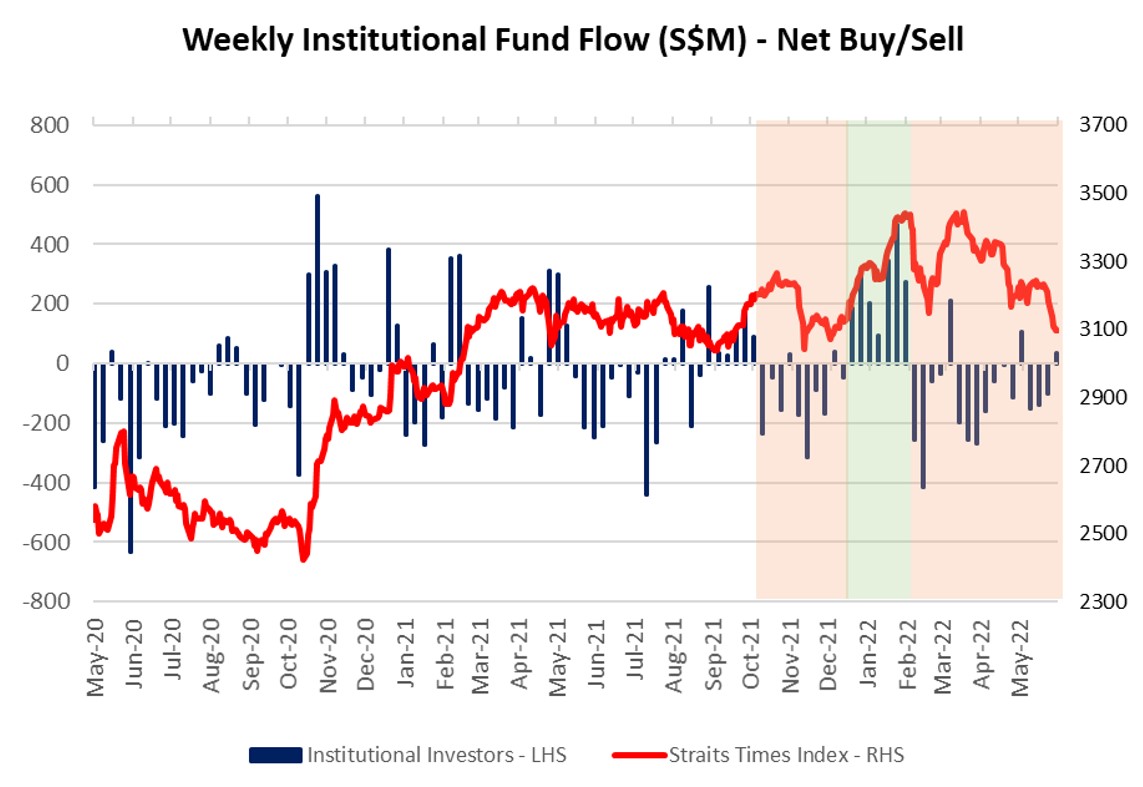
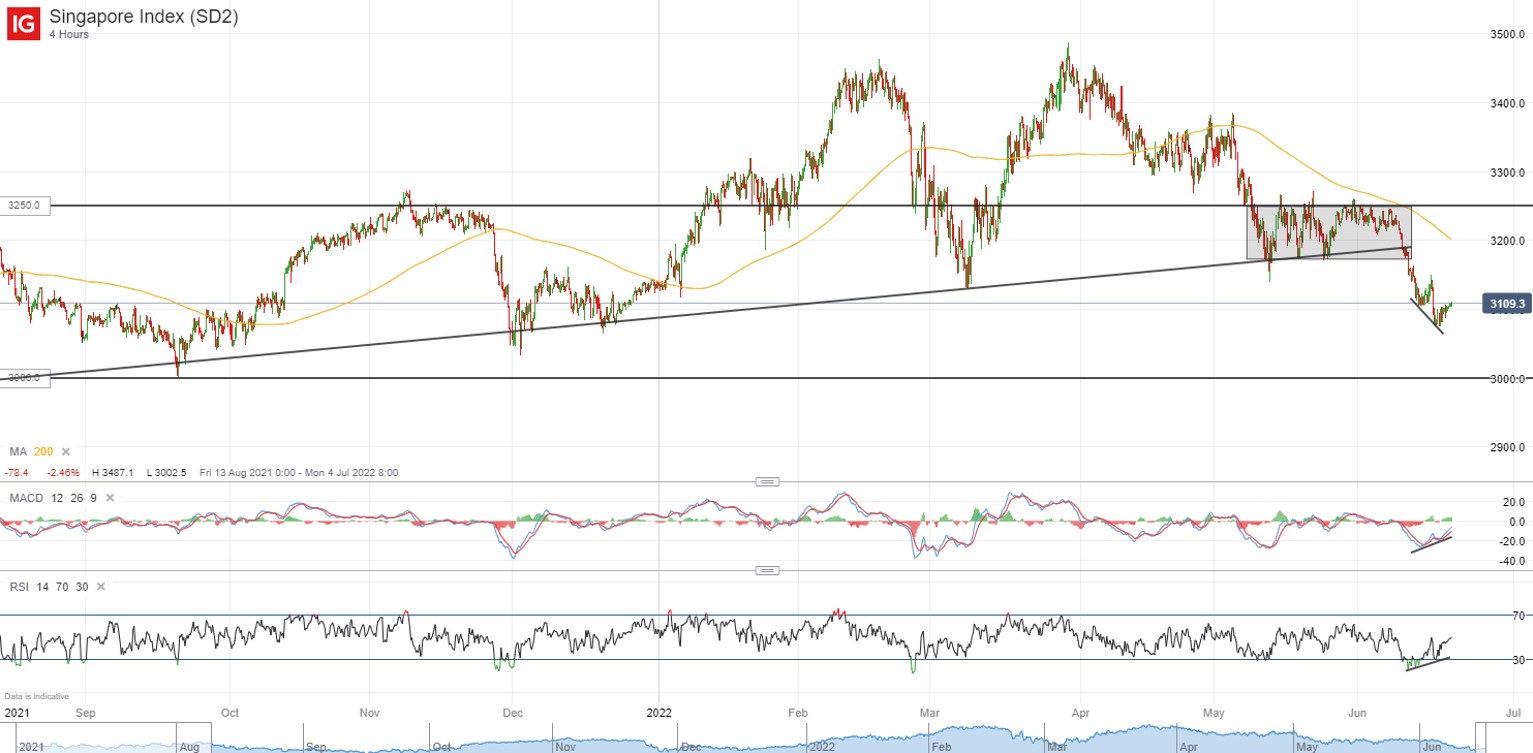
On another note, the latest SGX fund flow data revealed net institutional outflows for the STI taking a breather last week. That said, the amount of net inflows (+S$38mn) pales in comparison to previous weeks of outflows, suggesting that overall institutional interest in the STI remains low. On the four-hour chart of the STI, a bullish divergence in the moving average convergence divergence (MACD) indicator may point to weakening momentum to the downside and increase the chances of a near-term reprieve. That said, the longer-term trend is carrying a downward bias for now, with the index breaking below a key upward trendline in recent weeks, along with the formation of a new lower low. Any upside may leave the 3,175 level on watch as potential resistance to overcome, whereas near-term support may potentially be found at the 3,068 level.
 Source: SGX, IG
 Source: IG charts
On the watchlist: AUD/NZD attempting to hang above upward trendline ahead of RBA minutes
Ahead of the RBA minutes release, the AUD/NZD is attempting to hang above a key upward trendline, which has been supporting the pair on at least three occasions since March this year. To recall, the previous RBA meeting came with a surprise 50 basis-point rate hike, which far towered above market expectations of a 25 basis-point increase. With that, the meeting minutes will be looked upon for the central bank’s justification for its recent move, along with the expected pace of tightening ahead. For now, the upward trend for the currency pair remains intact with the higher highs and higher lows since November last year. The 1.094 level will be on watch as a key support to hold ahead, where a break lower may form a new lower low and suggests a potential shift in sentiments.
 Source: IG charts
Monday: US markets closed, DAX +1.06%, FTSE +1.50%


.jpeg.98f0cfe51803b4af23bc6b06b29ba6ff.jpeg)

0 Comments
Recommended Comments
There are no comments to display.
Create an account or sign in to comment
You need to be a member in order to leave a comment
Create an account
Sign up for a new account in our community. It's easy!
Register a new accountSign in
Already have an account? Sign in here.
Sign In Now