Is now the right time to buy Barclays shares?

Entry posted by MongiIG in Market News
1,070 views
Where to next for the Barclays share price following the bank’s acquisition of Kensington Mortgages?
 Source: Bloomberg
Several reasons for the Barclays share price to recover
With last week’s announcement that Barclays PLC is to buy the specialist mortgage lender Kensington Mortgages for £2.3 billion and the daily share price chart about to give another technical buy signal, is now the right time to buy Barclays stock?
The Barclays share price, which started the year on a strong footing with higher UK rates in the wings and was up over 15% by mid-January compared to the FTSE 100's 3% rise, has since given back half of its gains from its post-pandemic low, before resuming its ascent.
As rising UK interest rates provide a boost to lenders, Barclays’ acquisition of Kensington Mortgages at a time of intense competition in the mortgage market, could bolster the bank’s profits.
Despite worries of a looming recession and the cost of living crisis, UK house prices have continued to rise, even if the housing market is projected to cool later in the year.
UK interest rates have been rising by a quarter point to 1.25% last week as the Bank of England (BoE) is trying to stifle soaring inflation which hit a 40-year high of 9.1% in May. Further rate hikes are in the pipeline which should benefit lenders, provided that the housing market remains buoyant.
The Barclays share price has been caught between the positive effect of higher interest rates on revenues for financial products such as credit cards and loans and the negative impact of rapidly rising interest rates on stock prices, the ongoing war in Ukraine, strict Covid-19 lockdowns in China and recent general risk-off sentiment.
With China opening up again and several commodities such as Natural Gas, London Wheat and base metals such as aluminium having given back much of this year’s strong gains, the inflationary threat may be abating which could boost stock markets.
Is now the right time to buy Barclays shares?
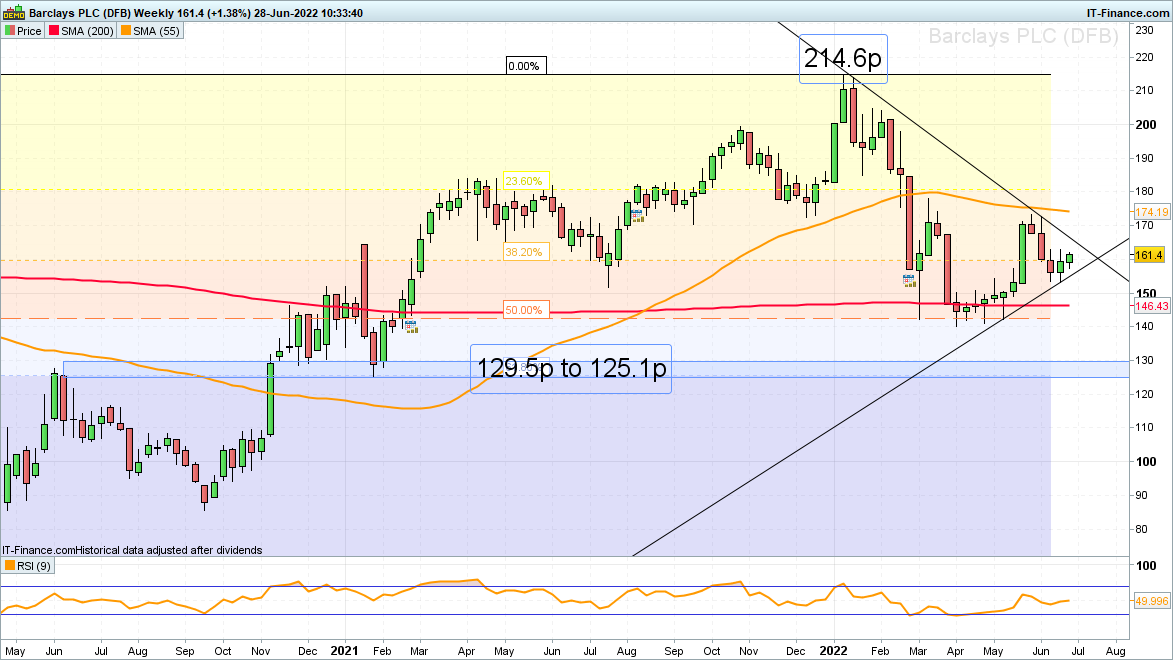
Exactly two months ago I argued that “with the share trading and seemingly holding around the 200-week simple moving average (SMA) at 146.4p and it already having retraced half of its gains since March 2020’s pandemic low at 70.3p [it] might be a good time to buy” Barclays shares.
 Source: ProRealTime
Since then, the Barclays share price has risen by close to 20% to its 173 pence late May high before coming off again, in line with general risk-off sentiment, triggered by fears of a global recession.
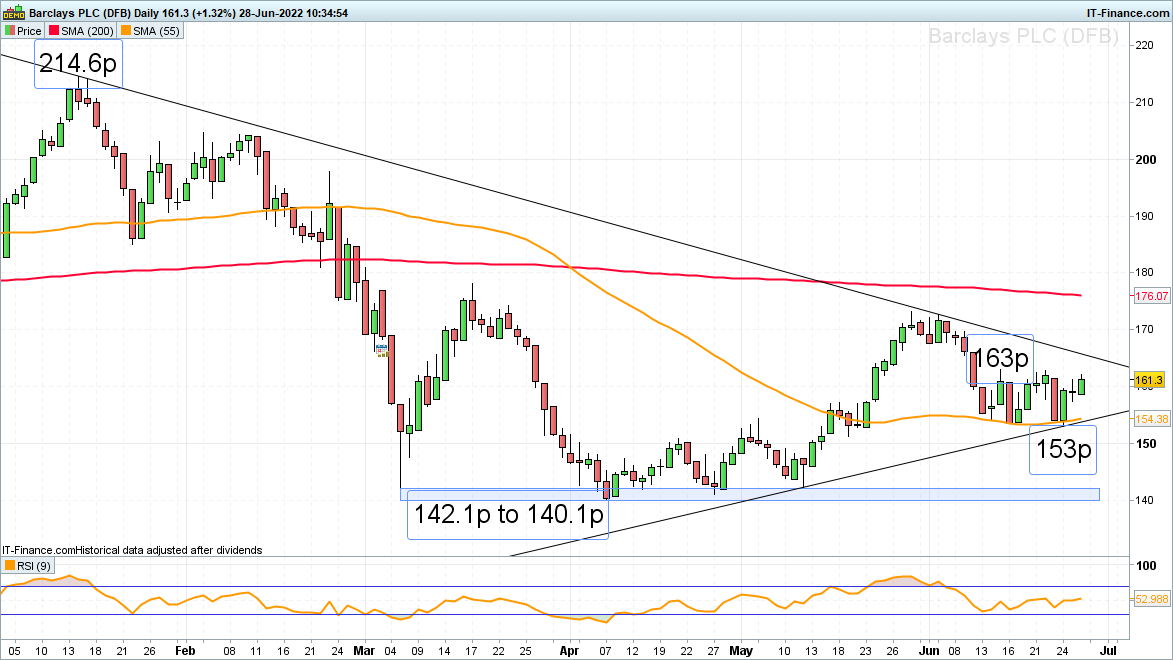
Since the UK mega bank’s share price held along the 55-day SMA at around 154p on three separate occasions since mid-June, the odds are that another plateau has been formed on the daily candlestick chart.
Therefore, provided that last week’s low at 153p isn’t being slipped through, and once the mid-June high at 163p has been exceeded, a bullish continuation of the Barclays share price’s advance from its March-to-May lows at 142.1p to 140.1p is expected to unfold.
 Source: ProRealTime
In this scenario this year’s downtrend line at 165.5p should soon be bettered with the mid-March, late May and early June highs as well as the 200-day SMA at 173p to 178p being in focus.
If overcome, a long-term bottoming formation would be confirmed with the January peak at 214.6p being back in the limelight. Only a currently unexpected bearish reversal and fall through last week’s low at 153p would negate the currently short-term bullish outlook. Even then the major March-to-May 142.1p to 140.1p support zone would once more be expected to hold.
Only a slip through 140.1p may lead to a sell-off taking the share to the 129.5p to 125.1p region which consists of the June 2020 high and January 2021 low and is also where the 61.8% Fibonacci retracement of the 2020-to-2022 advance can be found.


.jpeg.98f0cfe51803b4af23bc6b06b29ba6ff.jpeg)

0 Comments
Recommended Comments
There are no comments to display.
Create an account or sign in to comment
You need to be a member in order to leave a comment
Create an account
Sign up for a new account in our community. It's easy!
Register a new accountSign in
Already have an account? Sign in here.
Sign In Now