Some turnaround in US equity markets overnight but recession fears persist: US Crude, STI, EUR/USD

Entry posted by MongiIG in Market News
725 views
US equity markets faced a strong turnaround overnight, with earlier losses aggressively pared back towards the latter half of the trading session.
 Source: Bloomberg
Market Recap
US equity markets faced a strong turnaround overnight (DJIA -0.42%; S&P 500 +0.16%; Nasdaq +1.75%), with earlier losses aggressively pared back towards the latter half of the trading session. Outperformance in growth sectors did much of the heavy lifting, as these rate-sensitive sectors may have caught up to a further plunge in US Treasury yields to price for recession risks. The US 10-year yields moved lower to 2.80% yesterday, as market participants flocked to the relative safety of bonds amid a cautious risk environment. Recession concerns are clearly presented in the forefront, with the overnight inversion of the two-year and 10-year segment of the US yield curve while oil prices dipped more than 8% to come in below US$100.
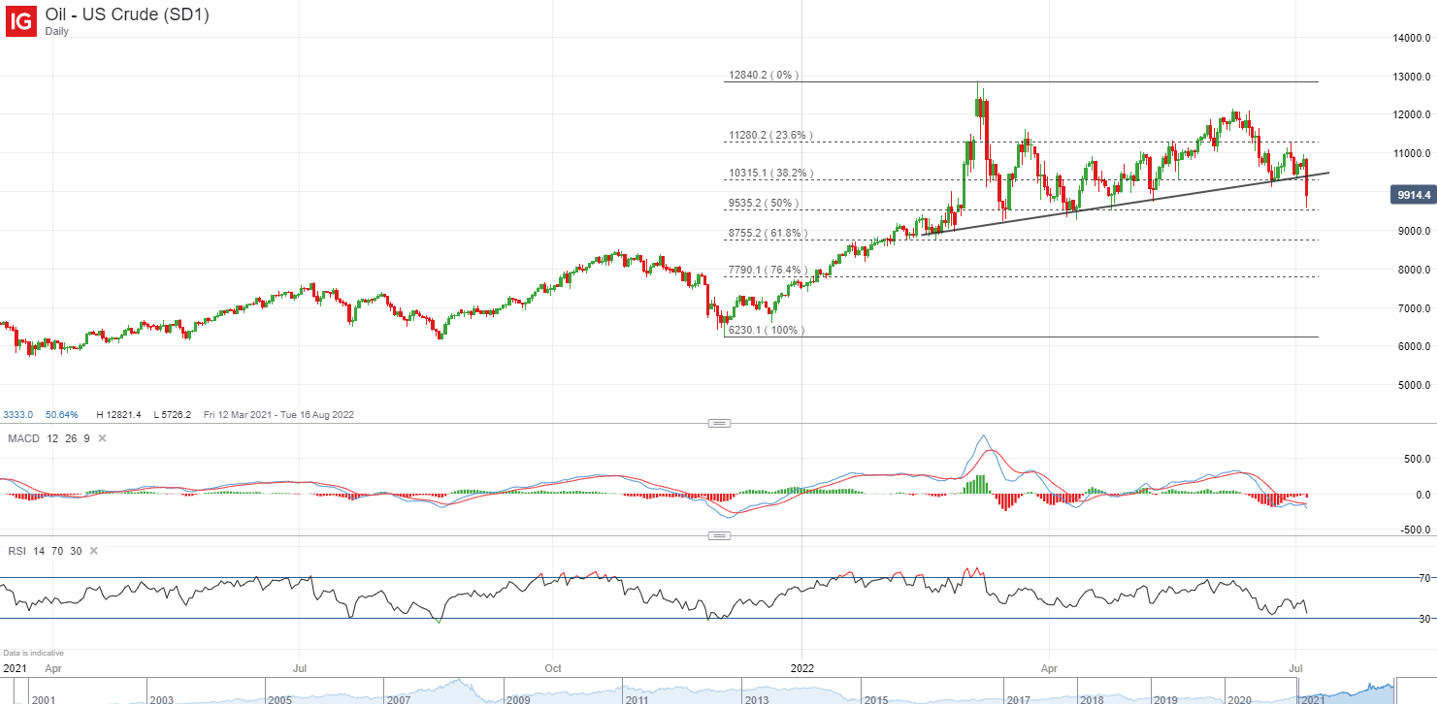
With the overnight plunge in oil prices, an upward trendline connecting higher lows since February last year has given way as recession fears appeared to override optimism for a still-tight oil market. For the US crude, prices may attempt to stay above the US$95.45 level but the formation of a new lower low seems to provide an overall downward bias for now. Resistance remains at the US$103.20 level, where the trendline resistance coincides with a key 38.2% Fibonacci retracement.
 Source: IG charts
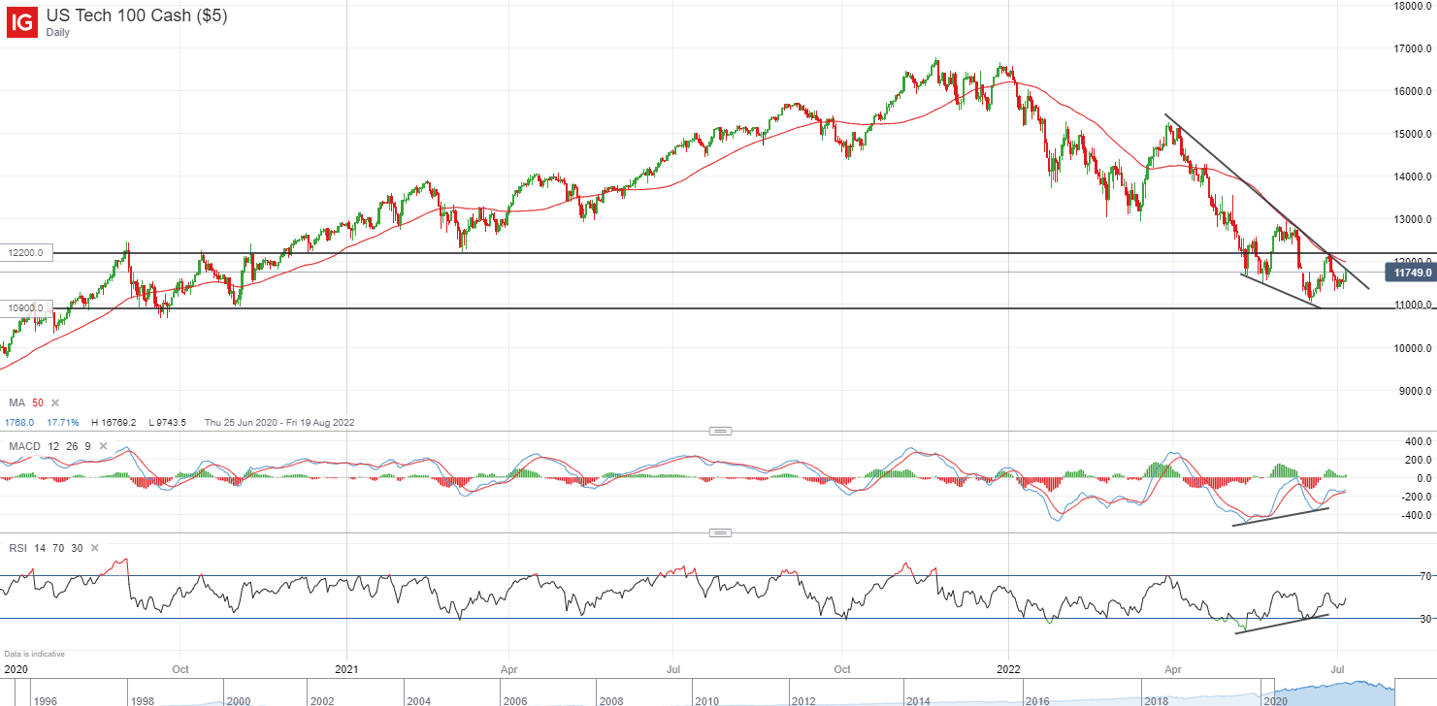
For the Nasdaq 100, the overnight 1.75% surge may provide some relief, but the index may not be out of the woods yet. Having largely traded within a descending wedge pattern, the up-move has brought a retest of its upper trendline, which will serve as resistance to overcome ahead. Markets seem to be at a point of reckoning, with the lower highs but higher lows suggesting some indecision. The upcoming Fed minutes will hence be looked upon as a key catalyst to drive greater shift in sentiments, along with any move by US President Joe Biden to remove tariffs on China which is still currently in a standstill.
 Source: IG charts
Asia Open
Asian stocks look set for a lower open, with Nikkei -0.94%, ASX -0.15% and KOSPI -1.16% at the time of writing. With the outperformance heavily concentrated in US big tech while recession fears remained as the key driver for risk sentiments, the Asia region may face a more muted session. The quiet schedule in the economic calendar may also drive some wait-and-see, as we look towards the US Institute for Supply Management (ISM) non-manufacturing purchasing managers' index (PMI) data, along with the Federal Open Market Committee (FOMC) minutes, to provide further hints of recession risks.
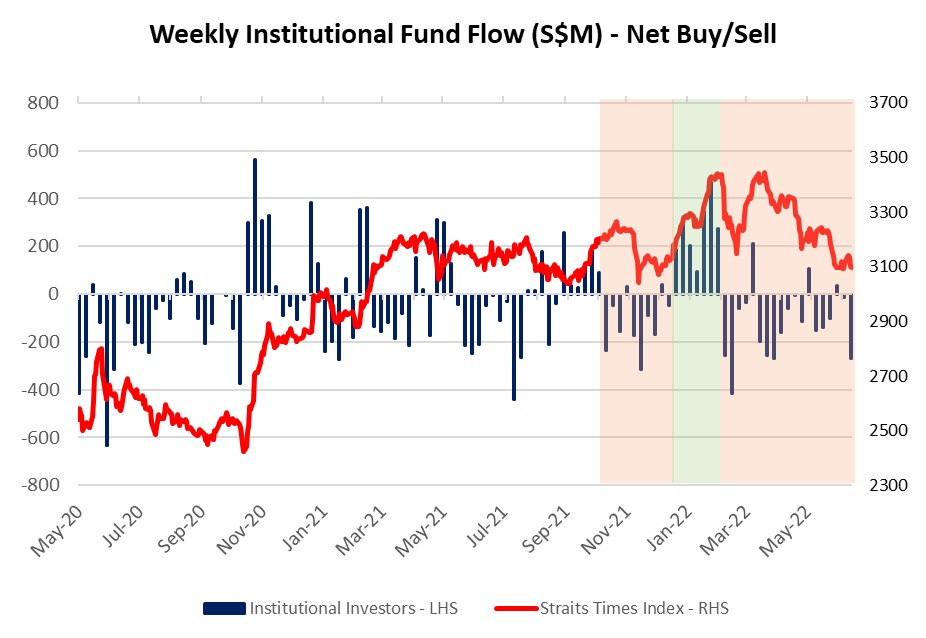
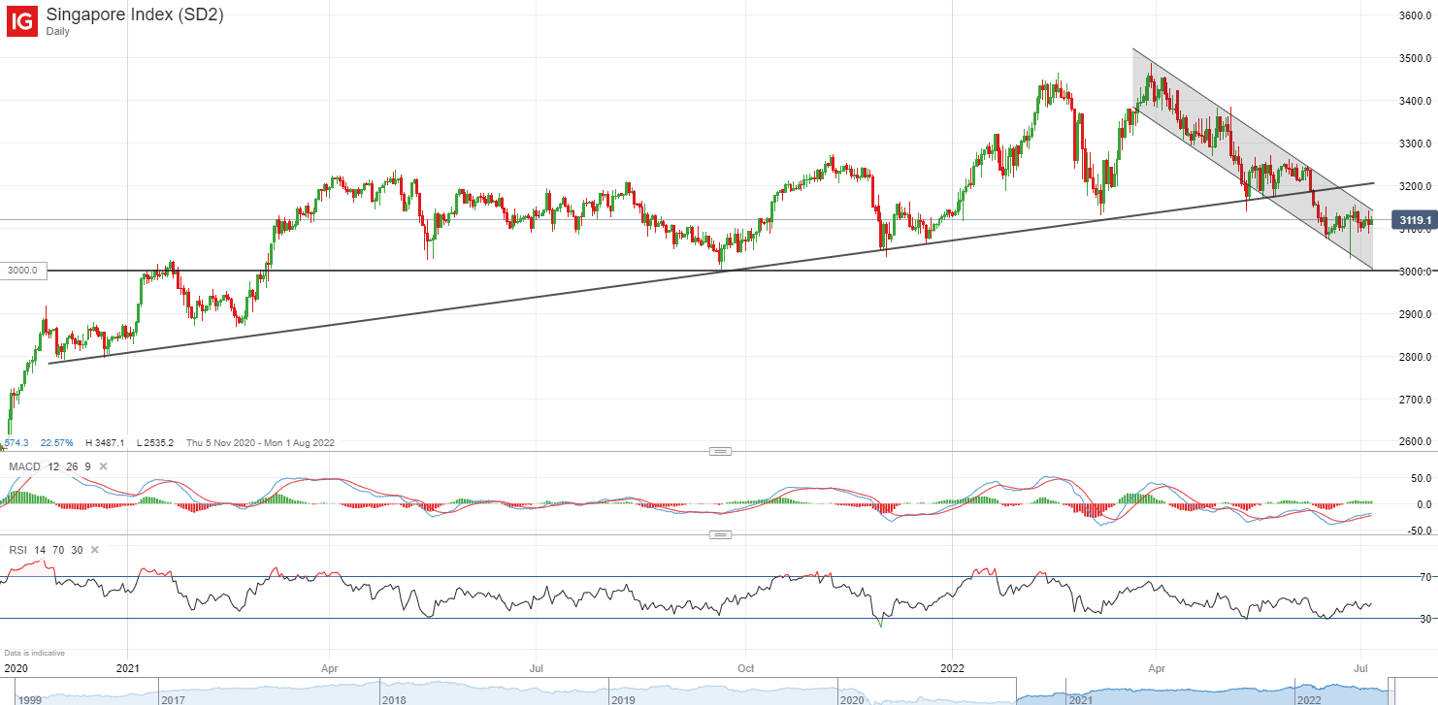
The latest SGX fund flow data revealed another week of significant net institutional outflows (-S$269mn) after a temporary reprieve towards late June, with positioning in the financial sector at its lowest level since March 2021. Therefore, it seems that a cautious risk environment is playing out for the Singapore market as well. The STI has been largely in consolidation over the two weeks but a downward trendline connecting lower highs since March this year seems to lie ahead as resistance at the 3,150 level. The overall downward bias for the index remain intact for now, with further downside potentially leaving the 3,000 key psychological level on watch.
 Source: SGX, IG
 Source: IG charts
On the watchlist: EUR/USD hits a new 20-year low
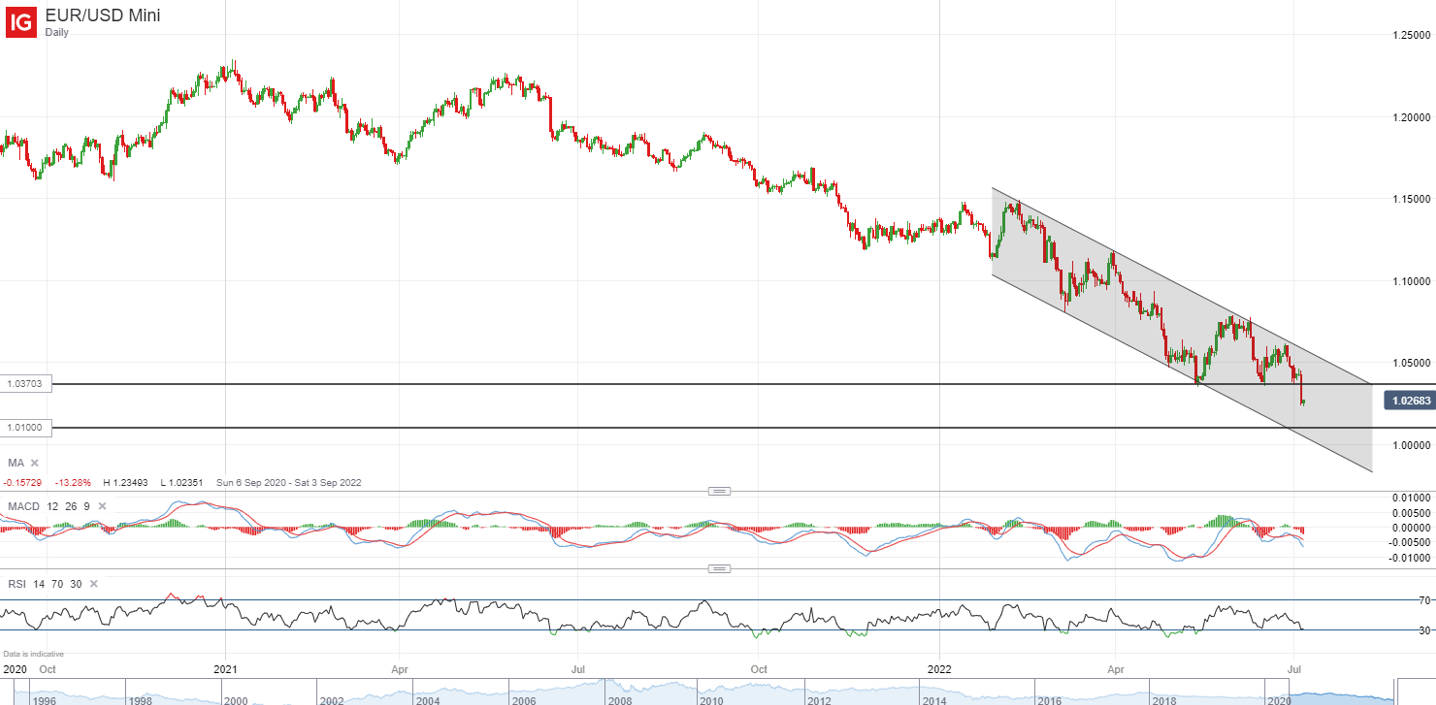
A surge in the US dollar has pushed the EUR/USD to its lowest level in 20 years, as the euro also struggled with a darkened economic prospect in Europe amid a gas shortage overhang. This led to a more aggressive paring back of rate hike bets for the European Central Bank (ECB) as compared to the US Fed, with the rate differential serving as headwind for the currency pair. The formation of a new lower low reinforces the ongoing downward trend and trading within the descending channel pattern in place since February this year could leave the 1.010 level on watch next.
 Source: IG charts
Tuesday: DJIA -0.42%; S&P 500 +0.16%; Nasdaq +1.75%, DAX -2.91%, FTSE -2.86%


0 Comments
Recommended Comments
There are no comments to display.
Create an account or sign in to comment
You need to be a member in order to leave a comment
Create an account
Sign up for a new account in our community. It's easy!
Register a new accountSign in
Already have an account? Sign in here.
Sign In Now