Three markets to watch following RBA meeting

Entry posted by ArvinIG in Analyst article
661 views
Following the RBA’s cash rate increase for the third straight month, we look at the ASX200, AUD/USD and Brent crude oil.

Source: Bloomberg
This week the Reserve Bank of Australia (RBA) increased its cash rate by 50 basis points (bps) to 1.35%, back to its highest level since May 2019. Moreover, RBA signalled that more interest rate hikes are on the way as inflation is expected to increase further throughout the year's second half.
Meanwhile, the US equity markets reopened after Independence Day to enjoy a modest gain as an early sign of easing inflation pressure ignited by the China-US tariff talk and plunging energy prices.
Today we look at three markets:
ASX
Last week the ASX closed the book for the 21/22 financial year with the worst monthly decline since March 2020. Overall, the ASX dropped 12% during the year's first six months.
Every year has its challenges and the past 12 months have been especially rough as we continue to fight Covid for the third year. The strong headwind of inflation has caught most central banks off guard and when combined with the war in Ukraine that commenced in late February, energy prices have increased to a level that hasn't been seen for decades.
Moving ahead, it's almost certain that most of the headwinds from the first half of the year will stay to generate more volatilities and unknowns will unfold.
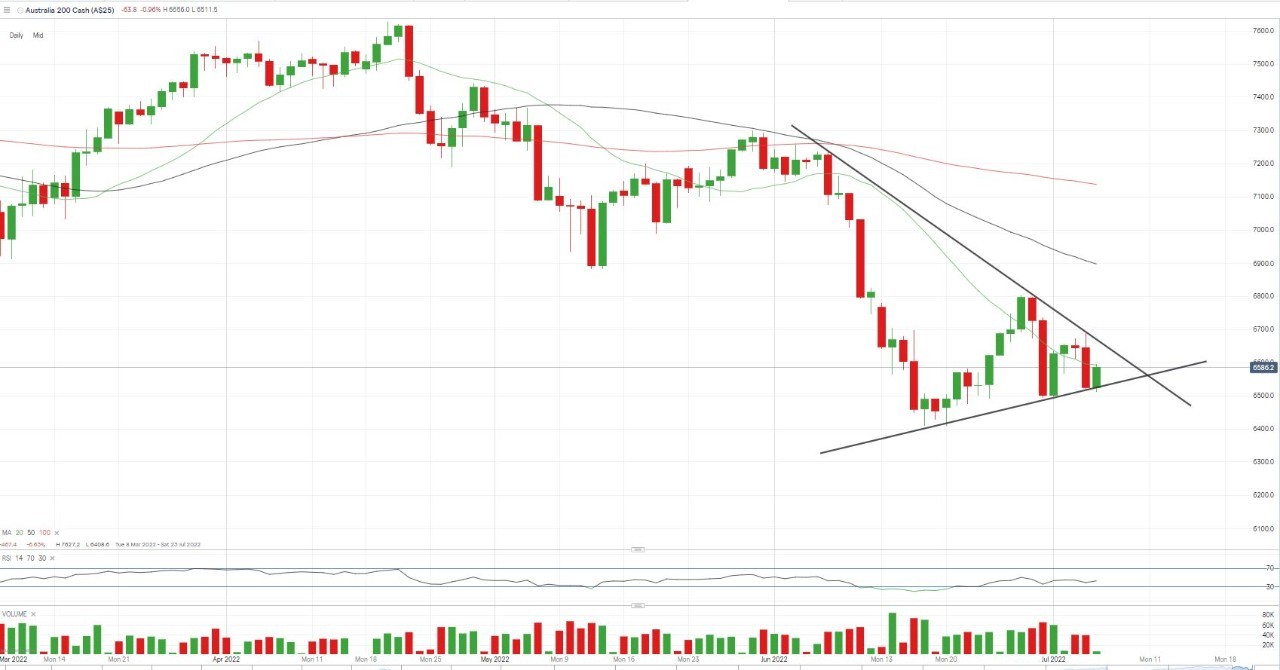
The ASX concluded the post-RBA session with a 0.25% gain on Tuesday. However, the candlestick still failed to break through the 20-day moving average, suggesting the short-term momentum is yet to revert. The cross so far briefly shot up to 6584 with support from the mid-term trend line and slips may find support near the May trough at 6540. On the other hand, should the price manage to stand above the 20-day MA in the next couple of days, the price target is looking at 6640.
Daily chart
Source: IG
AUD/USD
The Australian dollar rallied before the RBA meeting on Tuesday but then lost all the gains against the greenback after the announcement. The Reserve Bank of Australia tightened monetary policy for the third straight month, even though the central bank sounds optimistic to control the decade-high inflation. Furthermore, commodities continue to be crushed as concerns deepen about the slowing economies and under this momentum, the Australian dollar is poised to continue suffering the downturn pressure.
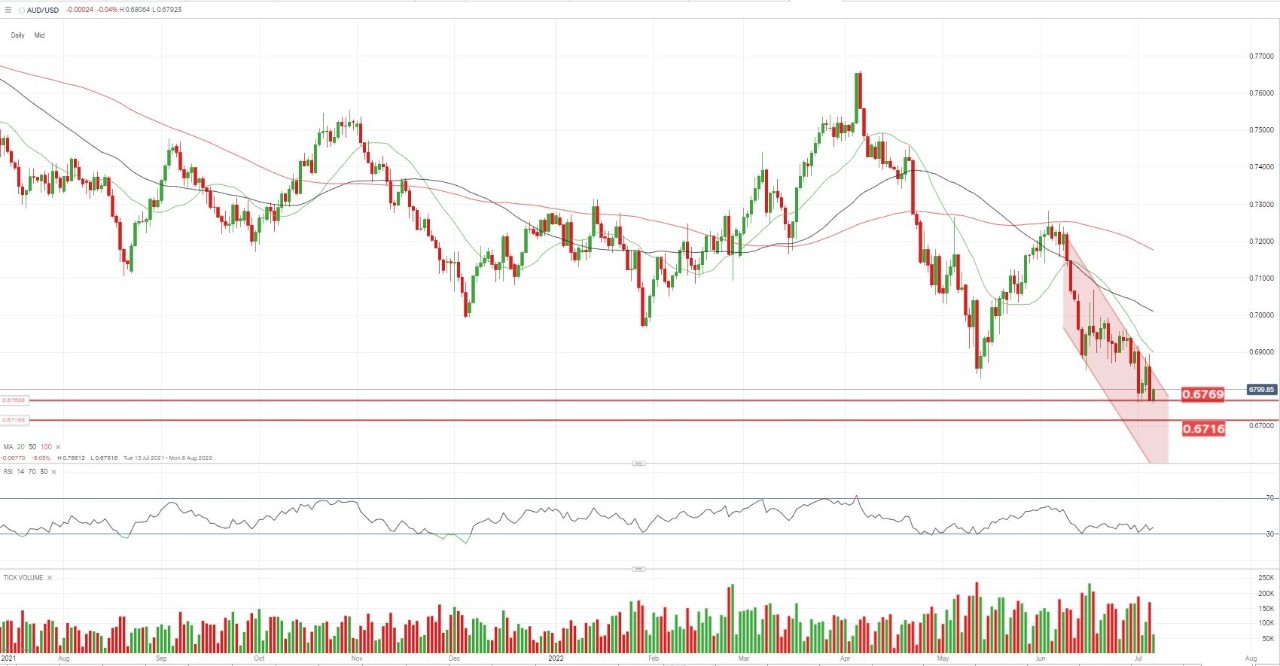
The Australian dollar has now pulled back to its two-year low level and current support can be found at $0.6789, which, if broken, will bring the next support at 0.6716 into view. On the flip side, any rebound attempt will face the challenge from the 20-day moving average, around 0.6890.
Daily chart
Source: IG
Brent crude
Oil plummeted by nearly 10% this week as concerns heightened over the global recession curtailing demand and as a result, oil prices have plunged below $100 a barrel for the first time since early May.
While Saudi Arabia lifted the August price for its flagship crude grade to Asia by $2.80 per barrel, the price of Brent and WTI crude fell sharply as the renewed recession fears outpaced the previous supply concern.
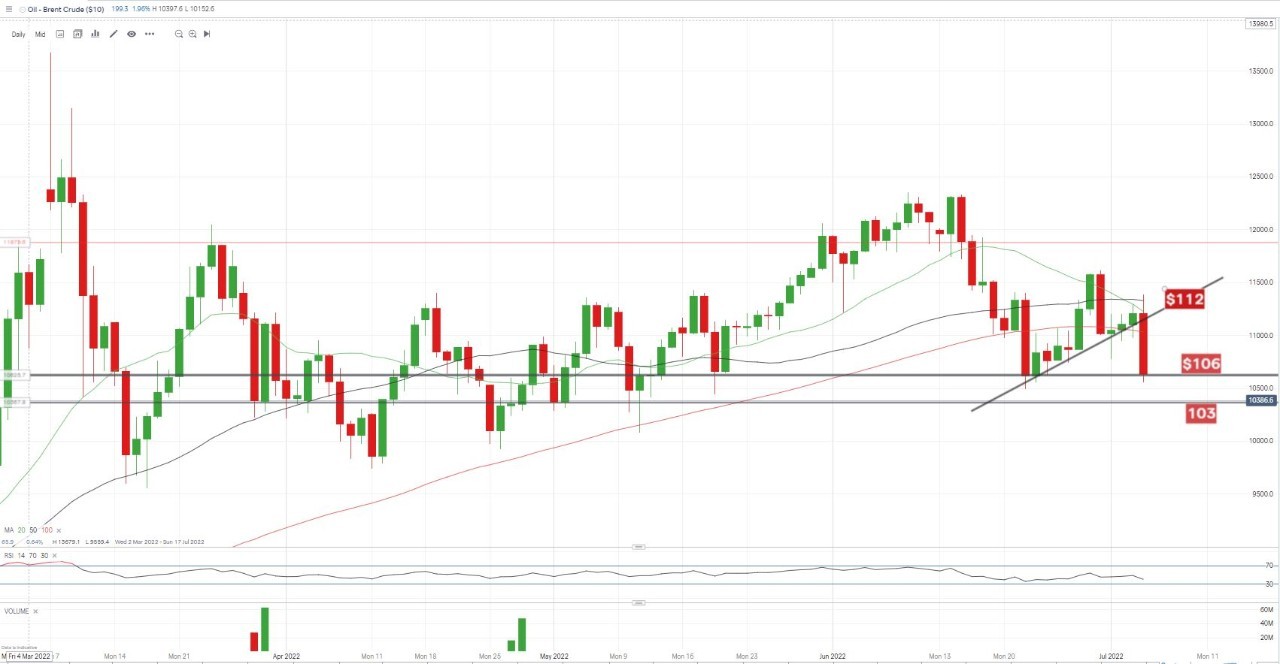
From a technical viewpoint, the price for Brent crude has pulled back to its level in May and a clear breakout from the trend line suggests the downturn spiral will be at play. Current support sits at $106, while the next support level at $103 is in prospect.
Daily chart
Source: IG
Take your position on over 13,000 local and international shares via CFDs or share trading – and trade it all seamlessly from the one account. Learn more about share CFDs or shares trading with us, or open an account to get started today.


.jpeg.98f0cfe51803b4af23bc6b06b29ba6ff.jpeg)

0 Comments
Recommended Comments
There are no comments to display.
Create an account or sign in to comment
You need to be a member in order to leave a comment
Create an account
Sign up for a new account in our community. It's easy!
Register a new accountSign in
Already have an account? Sign in here.
Sign In Now