McDonald’s share price: what to expect from Q2 results

Entry posted by MongiIG in Market News
564 views
Find out what to expect from McDonald’s earnings results, how they will affect McDonald’s share price, and how to trade McDonald’s earnings.
 Source: Bloomberg
When is McDonald’s results date?
Tuesday, July 26th before the market opens is when McDonald’s Corporation is expected to release its figures for the second quarter.
McDonald’s share price: forecasts from Q2 results
Hopes are it won’t just weather the storm but manage to best readings of the past two quarters despite an adjustment. Inflation has been a top concern amongst consumers, and in the first quarter were already beginning to select cheaper items on the menu or reduce the size of their orders, a theme that’s likely to have continued in the second quarter as necessity expenditures remained high, negatively impacting their overall purchasing power. The fast food chain is considered somewhat fortunate to be servicing the value segment of the industry at a time when value is the top priority, so it’s a matter of seeing how the defensive stock has fared in the current tested macroeconomic environment.
It isn’t just the consumer that’s had to deal with rising prices, for McDonald’s has got its own inflation-related issues to sort out with rising commodity and labour costs which combined represent nearly half of the total, and none can deny those two have only gotten costlier.
Its CFO last time around expected higher inflation pressures to persist throughout the year, and those expectations are unlikely to have changed given the latest CPI (Consumer Price Index) readings that have only gotten hotter. There are also any ongoing supply chain woes, and to what extent that and rising costs can be passed onto price-conscious consumers, and whether it’ll impact its sought-after margins is to be seen.
Investors will also be noting the impact of ending its Russia business and the nearly 850 branches there, the rollercoaster of sales in China due to restrictions in some areas, and investment in deliveries given digital orders previously were a boon.
McDonald’s is seen as more established and hence a relative safe haven compared to franchises trying to grow faster at a time when growth has been punished with a dividend yield higher than the S&P 500 average, a strong record when it comes to paying out, and a strong balance sheet at a time when investors aren’t looking to take many chances in a period of central bank aggressiveness.
Unlike plenty of other restaurants in the industry (as well as most sectors), the fall in McDonald's share price has been relatively sedate, down about 5% since the start of the year. That’s considered holding the line when viewed in comparison to the 25% or more losses suffered by Chipotle, Domino’s Pizza and the AdvisorShares’ EATZ ETF.
The P/E (price to earnings) ratio might have averaged in the lower teens a decade ago, but it’s been over 25 and well above the average for a value stock, meaning expectations are higher in terms of earnings growth, and means it’s got more to live up to.
In comparison to other company valuations, it’s one of the lesser attractive points for discount-seeking investors.
In all, expectations this time around are for an earnings per share of $2.46, higher than the same period last year at $2.37, and an estimate that’s little changed over the past few months. Revenue is expected at $5.82bn, below 2021’s Q2 $5.89bn.
It managed to best estimates last time around for both earnings and revenue, though the first-quarter net income of $1.1bn couldn’t match year-on-year comparisons.
As for recommendations, it’s still majority buy with none opting for an underperform or sell, and more than a handful venturing into strong buy territory. As for their price targets, they’re mostly above the current share price, with an average roughly at $280
McDonald’s Weekly Chart with key technical indicators
Looking at the weekly chart below and breaking down the key technical indicators one by one shows the price above its main long-term weekly moving averages (but where the 50-week isn’t that far off). Nearing the upper end of the weekly Bollinger Bands, with its DMI (Directional Movement Index) neutral given the lack of a significant margin of the DI- over the DI+, and an RSI (Relative Strength Index) reading far from overbought and oversold territories. Its ADX (Average Directional Movement Index) is also beneath trending ranges.
The daily time frame paints a somewhat similar picture with its mid-term roughly $260 resistance level managing to hold thus far as of writing. Prices are also coming off what has been narrowed bands, but where its DI+ is above its DI- instead and by a better margin.
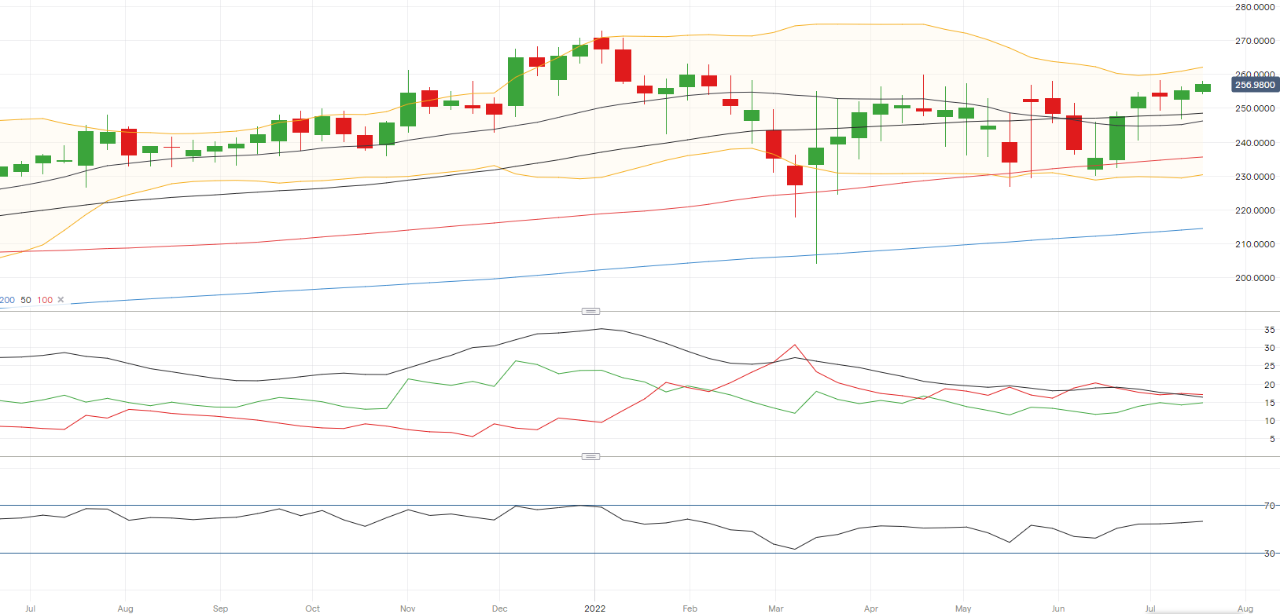 Source: IG
Trading McDonald’s Q2 results: technical overview and trading strategies
Looking at the above, and it’s understandable why classifying its technical overview in this situation is a bit trickier, as oscillations within larger bands can translate into minitrend moves that go beyond ‘consolidation’ even if it averages back, and more so when we’ve got a fundamental event with the earnings release. There’s also the question of intraweek volatility, on average offering moves past 1st weekly levels since the start of May but struggl4e for weeks prior to that.
That makes it ‘consolidation – volatile’ in what has been a move back towards an average (even if that average has been rising with positive technical bias forming), with intraweek movement where there are big moves related to risk appetite more volatile than consolidatory but inter-week averaging back. That doesn’t guarantee conformist breakout strategies will outperform, though ideally those going contrarian with a reversal doing so after a very cautious one.
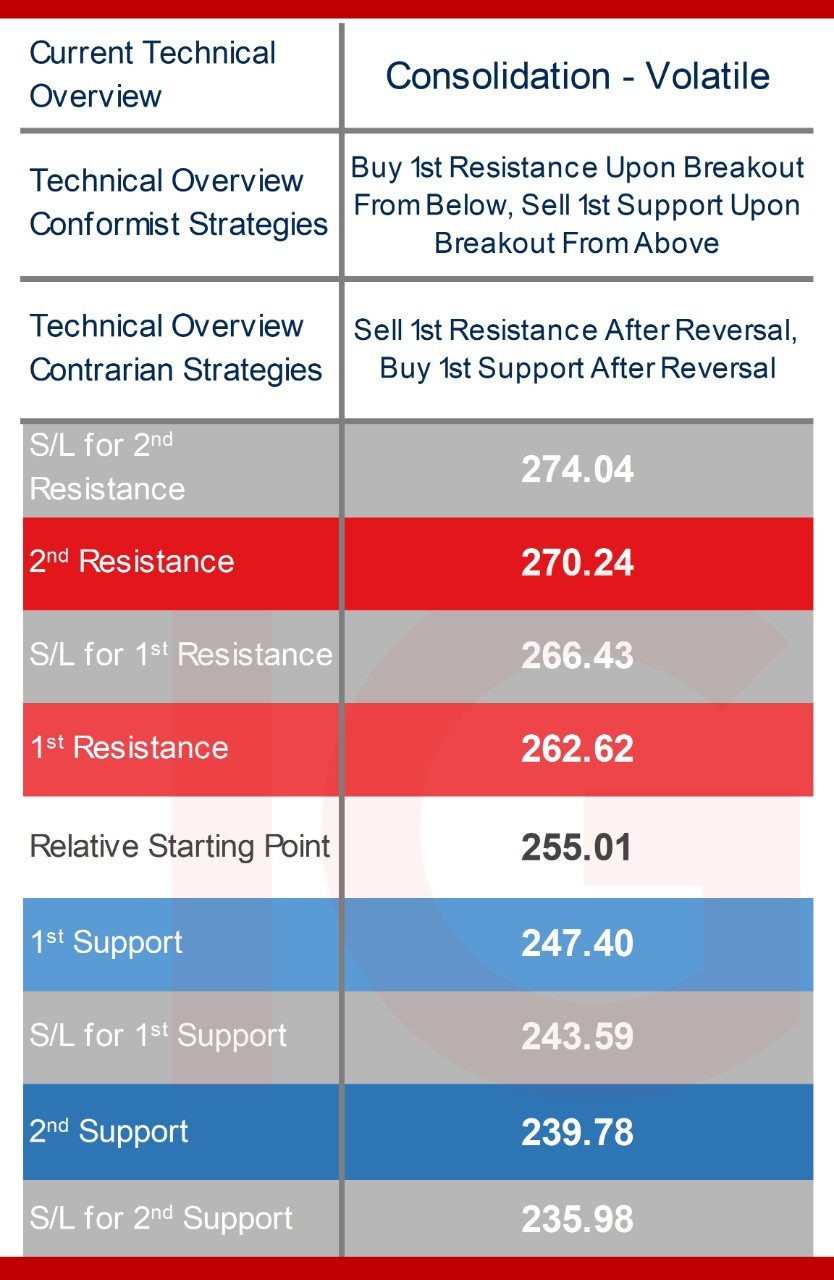 Source: IG
IG Client sentiment* and short interest for McDonald’s shares
When it comes to sentiment amongst retail traders, the bias has been extreme buy, and little changed over the past week with the reading at 84% as of this morning from 85% prior.
Short interest on the exchange is below 1% with more than 6.2m share shorted of the roughly 740m shares floating.
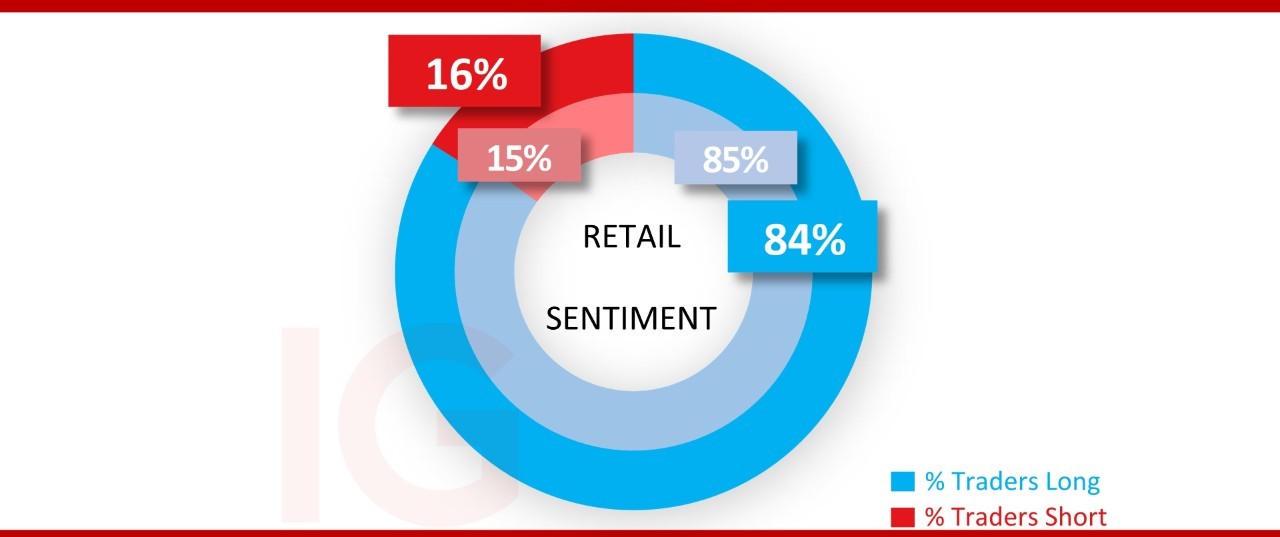 Source: IG
*The percentage of IG client accounts with positions in this market that are currently long or short. Calculated to the nearest 1%, as of today morning 8am for the outer circle. Inner circle is from a week ago.


0 Comments
Recommended Comments
There are no comments to display.
Create an account or sign in to comment
You need to be a member in order to leave a comment
Create an account
Sign up for a new account in our community. It's easy!
Register a new accountSign in
Already have an account? Sign in here.
Sign In Now