Alphabet Q2 earnings preview: who will win the budget competition in online ads?

Entry posted by ArvinIG in Analyst article
734 views
Alphabet will report its Q2 earnings on 26 July after the market closes. The focus will be on Google’s advertising revenue which is suffering strong headwinds as the economy slows down.

Source: Bloomberg
When is Alphabet’s earnings date?
Alphabet will report its second quarter (Q2) earnings on July 26th, after the market closes. The report will be for the fiscal quarter ending June 2022.
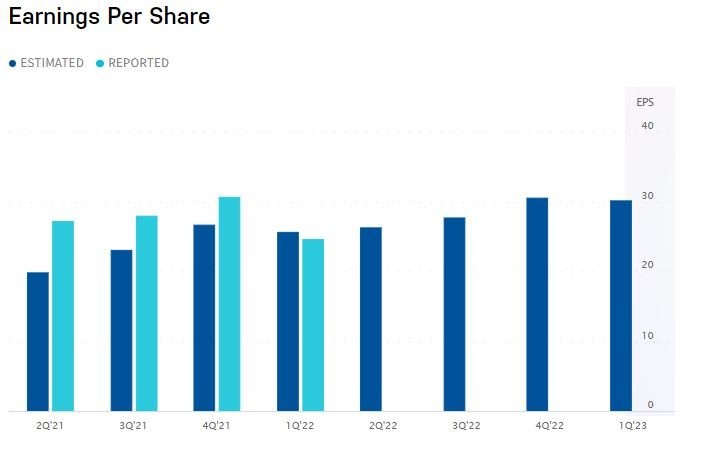
Alphabet earnings: what to expect?
Earnings per share at $1.3, 5% decline year-on-year but marginally up from the previous quarter
Revenue of $70.25 billion, up 13% YoY and from the 68.01 billion in Q1.
Alphabet fundamental and valuation
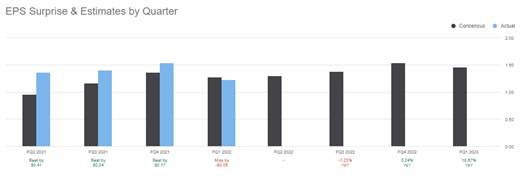
To many people’s surprise, the search engine giant missed the expectation in its opening quarter of the year despite total revenue surging 23% year-on-year to $68 billion. The market believed the business would regain its growth path in the third quarter, implying thar second quarter earnings are more than likely to be lacklustre.
Source: Nasdaq
Nevertheless, Alphabet's fundamental goal remains solid as the search engine king continues to pursue growth in diverse segments like cloud, subscriptions, advertising, and hardware. The Google Cloud department performed well in all business segments as Q1 revenue rocketed 43.8% to $5.8 billion year-on-year.
In terms of margin, its gross and operating profit margin remained steady year-over-year at 43.5% and 29.5%, respectively. These are encouraging growth rates and impressive metrics for a company of Alphabet's size.
At this stage, Alphabet's latest twelve months p/e ratio is 20.2x, well below its five-year average ending December 2017 to 2021 of 32.4x.
Alphabet faces challenges ahead
Google recently confirmed it is slowing down its hiring process. The move has sparked fear that the tech giant is facing challenges stemming from a decelerating economy and is in turn, preparing for a tough time.
Source: SeekingAlpha
In the scenario of a recession, the advertising segment would be the first sector to feel the pain. In the first quarter of 2022, 80% of Google’s total revenue came from Google advertising, including revenue from Google search, ads on YouTube, and the Google network. Although the Q1 advertising revenue has shown a 22% robust growth from the previous year, the pace is expected to slow from the second quarter as the global economy loses steam without the pandemic support.
Source: eMarketer
AlphabetAlphabet Inc - C (All Sessions)Alphabet Inc - A (All Sessions)It must be said that even in an economy brimming with uncertainty and risks, shareholders should still keep good faith with Alphabet’s capability to navigate through the tough time's thanks to its exceptional balance sheet.
According to the Q1 financial report, the search engine operator boasted $20.9 billion in cash and cash equivalents and an enviable free cash flow (FCF) of $69 billion over the past 12 months. Therefore, even under pressure, an economic slowdown and soaring interest rates, the company’s first-class balance sheet and cash-generating capability will undoubtedly provide a safety net for the business to overcome economic changes.
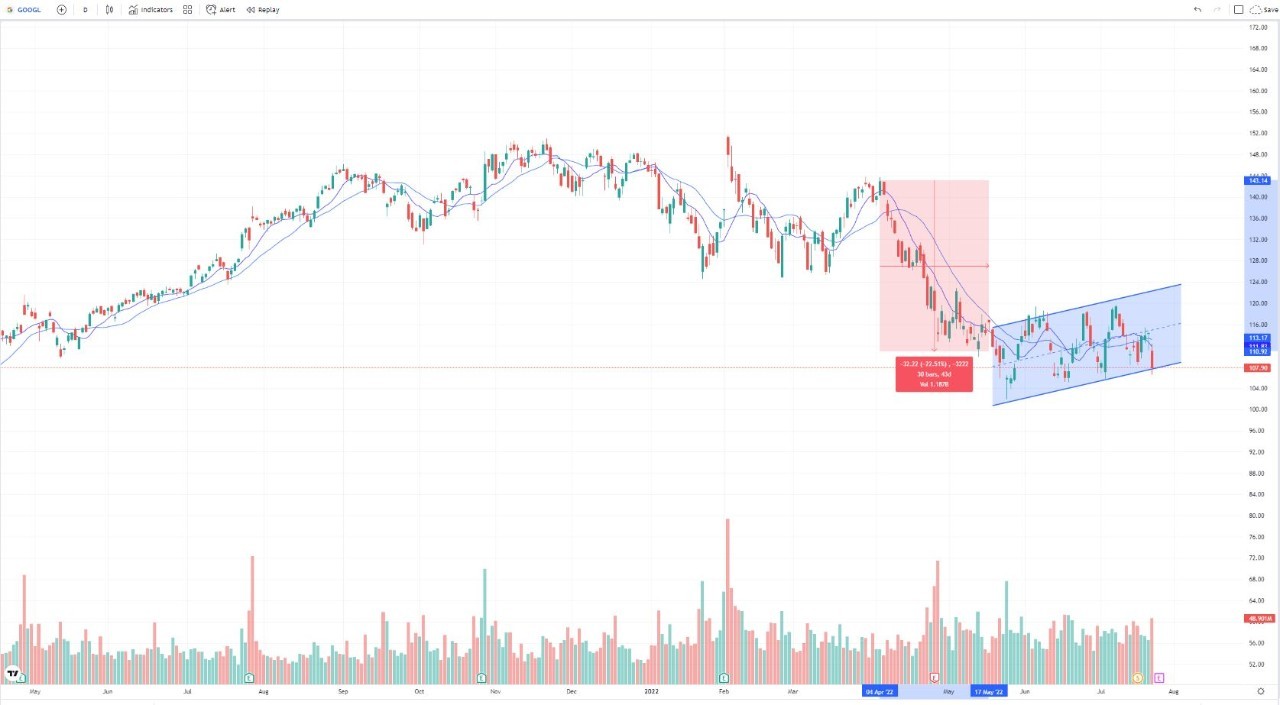
Alphabet share price: technical analysis
Alphabet's shares price has hit a roadblock by falling 23% since the start of the year. Last week, shares of companies dependent on online advertising fell sharply after Snap reported disappointing second-quarter results. Alphabet’s stock also suffered a hit by falling more than 5%.
Based on its daily chart, the price of Alphabet has been moving along with the ascending tunnel connected with higher lows. However, the price looks to be at risk of breaking through the tunnel's lower boundary which could spark a new round of decline.
The next support can be found from the level of $105 which represents the lowest level in two months. On the flip side, the next pressure level should look at the 20-day moving average, around $113.
Alphabet daily chart
Source: TradingView
Take your position on over 13,000 local and international shares via CFDs or share trading – and trade it all seamlessly from the one account. Learn more about share CFDs or shares trading with us, or open an account to get started today.
Hebe Chen | Market Analyst, Melbourne
25 July 2022


.jpeg.98f0cfe51803b4af23bc6b06b29ba6ff.jpeg)


0 Comments
Recommended Comments
There are no comments to display.
Create an account or sign in to comment
You need to be a member in order to leave a comment
Create an account
Sign up for a new account in our community. It's easy!
Register a new accountSign in
Already have an account? Sign in here.
Sign In Now