FOMC meeting and big tech earnings calls for some wait-and-see: US dollar, USD/SGD, Gold

Entry posted by MongiIG in Market News
497 views
The end of last week saw major US indices snapping their three-day winning streak, as earnings underperformance and weak guidance from Snap cast a cloud of uncertainty over the outlook for social media and technology companies.
 Source: Bloomberg
Market Recap
The end of last week saw major US indices snapping their three-day winning streak, as earnings underperformance and weak guidance from Snap cast a cloud of uncertainty over the outlook for social media and technology companies. The communication services sector plunged lower by more than 4.3%, while market participants displayed a defensive lean with outperformance in the utilities and consumer staples sectors.
Apart from earnings jitters and potentially profit-taking heading into the weekend, the flash Purchasing Managers' Index (PMI) figures out from US took the spotlight, which marked a sharp contraction in economic activities. To recall, the S&P Global composite index dived to its 26-month low at 47.5 from 52.3 in June, while the services sector also sank far below expectations into contractionary territory (47 versus 52.6 forecast). A reversal of pent-up consumer demand from rising cost of living, higher rates and gloomy economic outlook was highlighted as the weighing catalysts. With that, growth risks being reinforced by the data translated to a further fall in US Treasury yields, with bonds gaining some traction lately on its relative safety in an economic downturn. The US dollar was met with an initial move lower on potential Fed-easing bets, but was eventually underpinned by the risk-off mood.
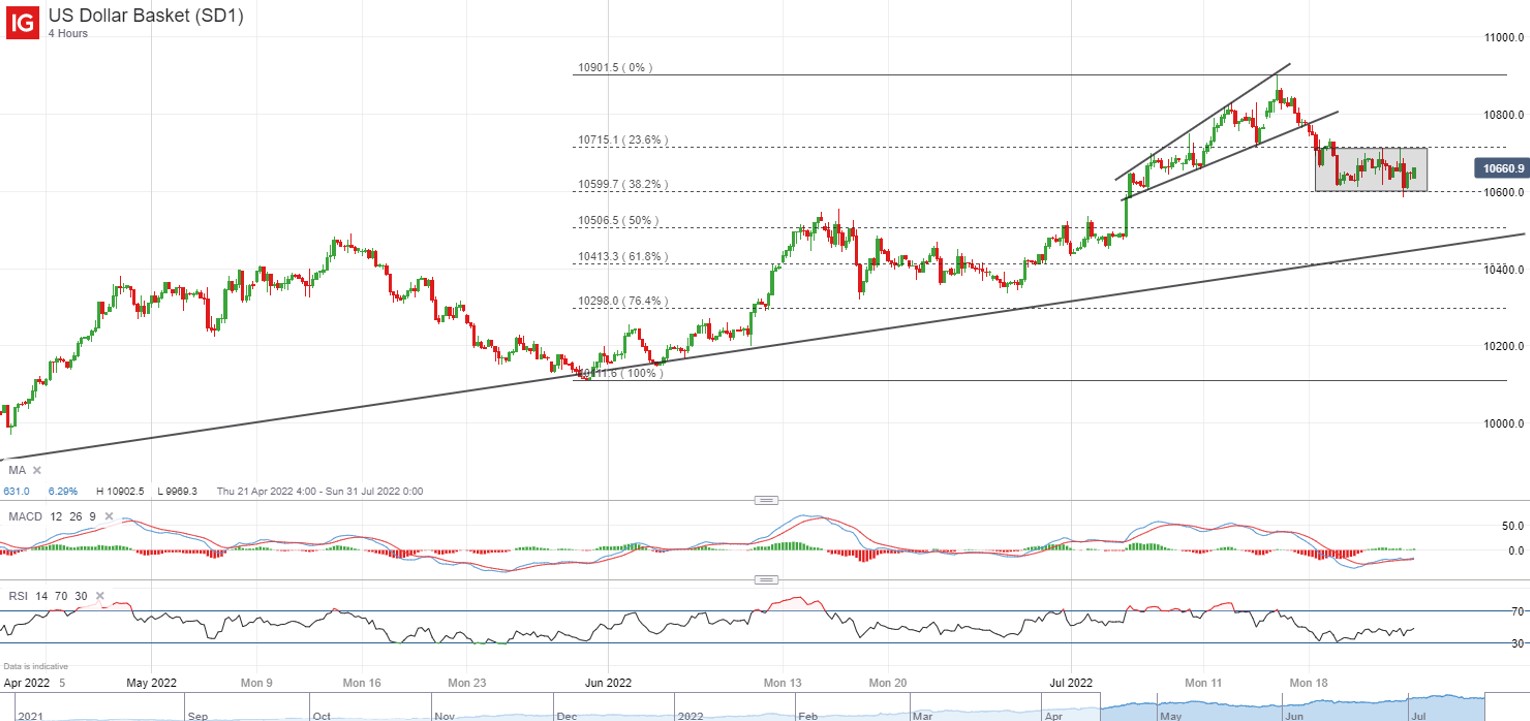
A break below an ascending broadening wedge pattern on the four-hour chart has left the US dollar trading within a consolidation zone last week, largely bouncing between the 23.6% and 38.2% Fibonacci retracement levels. Sentiments could be on hold with the Federal Open Market Committee (FOMC) meeting ahead, and while a 75 basis-point (bp) is largely anchored for this week, guidance for the September’s meeting will be on close watch as well, with opinions split between a 50 and 75 bp hike. One may watch for any break above the ranging pattern on either sides to denote a clearer shift in sentiments ahead.
 Source: IG charts
For the S&P 500, the index hitting extreme pessimism since June has driven some dip buyers back into action last week, with the index forming a new higher high. Despite the downbeat economic data, the near-term upward trend may still seem intact for now, with any formation of a new higher low on watch. Much will depend on several key catalysts ahead as we look towards a busy week of big tech earnings releases, FOMC meeting and key economic data such as Personal Consumption Expenditures (PCE) price data and US second quarter gross domestic product (GDP), all likely to place recession risks and Fed’s policy tightening at the centre stage once more.
Asia Open
Asian stocks look set for a mixed open, with Nikkei -0.68%, ASX -0.04% and KOSPI +0.29% at the time of writing. A negative handover from Wall Street to end last week may lead to a more cautious tone in the Asia session today, as some wait-and-see could play out heading into several key risk events this week. US-listed Chinese equities were dragged lower by the tech weakness in Wall Street last Friday as well, with the Nasdaq Golden Dragon China Index falling 4%. A lingering caution may still seem to hang around with a confluence of risks from virus cases and its property sector.
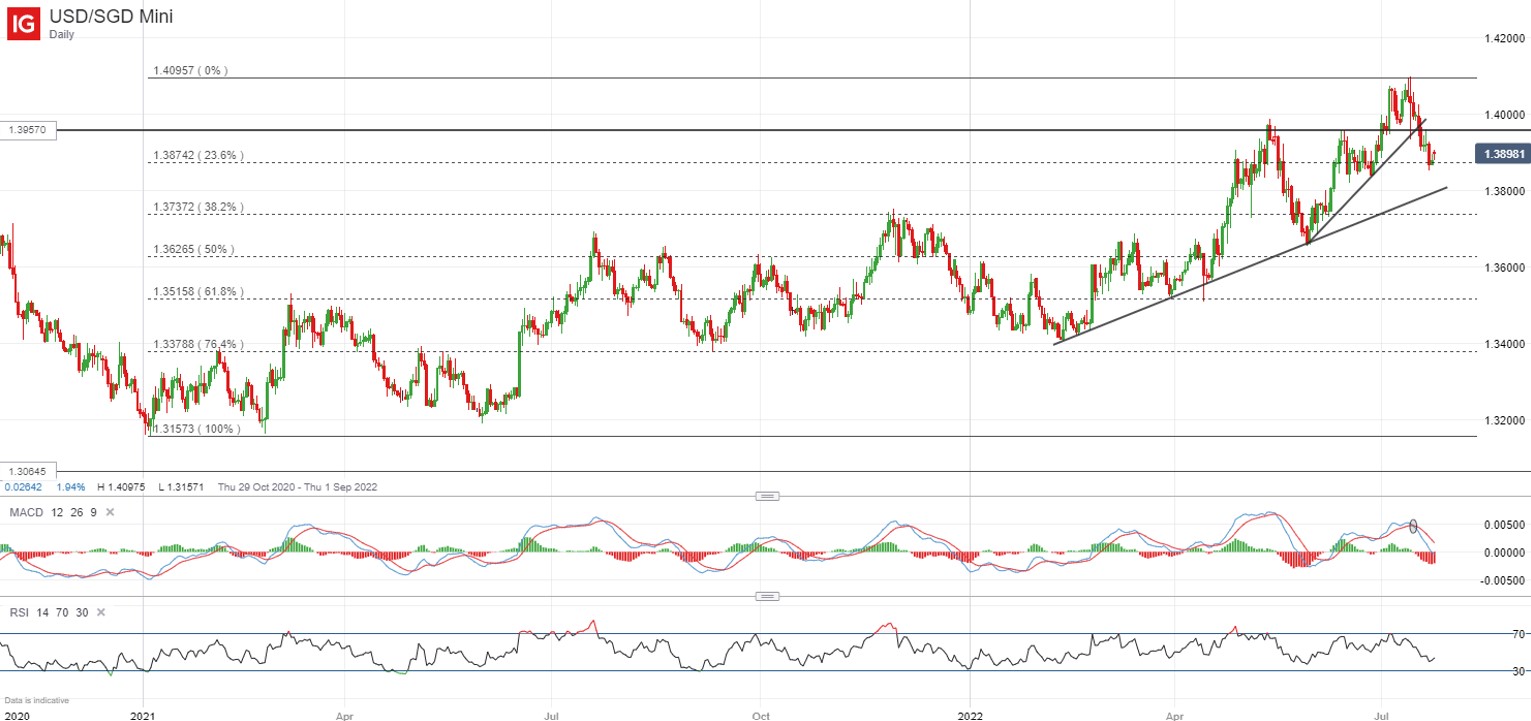
The day ahead will leave the Singapore’s Consumer Price Index (CPI) data on watch. Expectations are for headline inflation to rise further to 6.2% from previous 5.6%, with its core aspects to come in at 4.2% year-on-year (YoY) from previous 3.6%. The data release may support the need for the recent off-cycle tightening move two weeks back, but the key question will be whether further tightening is warranted in another off-cycle move or in the October Monetary Authority of Singapore (MAS) meeting. Any upside surprise in inflation data ahead today will be looked upon for that, leaving the USD/SGD in focus. After breaking below a near-term upward trendline, the currency pair is attempting to find support at a key 23.6% Fibonacci retracement level at the 1.387 level. The greater driver may be centred on US dollar’s move, with the Fed’s rate guidance on the September’s meeting on close watch.
 Source: IG charts
On the watchlist: Crucial week for gold prices as it hangs above key support
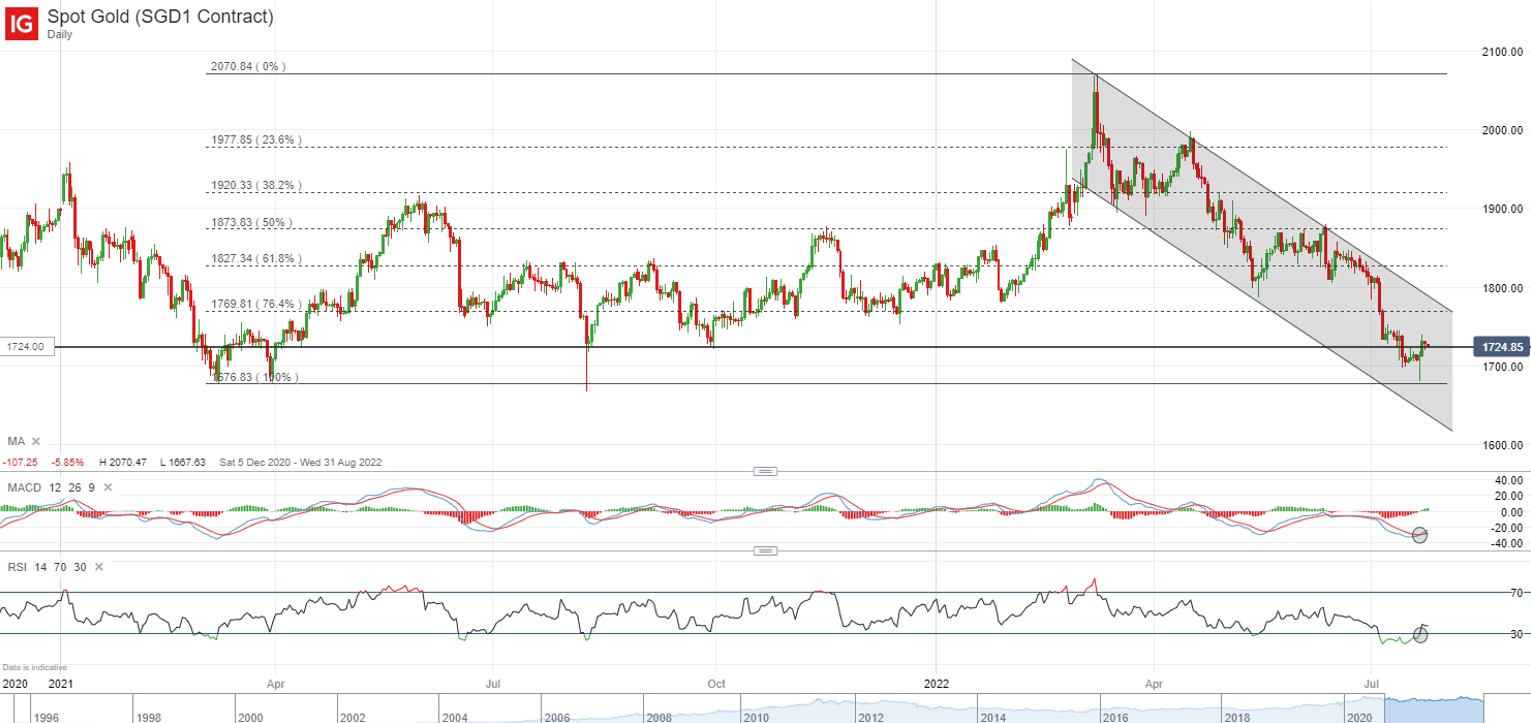
Heading into an important week of the Fed’s interest rate decision, gold prices were attempting to move higher towards the end of last week, reclaiming back above the US$1,724 level. On the technical front, a bullish pin bar was met with a follow-through, along with a bullish crossover formed on moving average convergence divergence (MACD) while the relative strength index (RSI) reverted into neutral territory from previous oversold levels. Whether gold prices can find a more sustaining upside may largely revolve around the Fed’s guidance of how they expect pricing pressures to drive their scope of tightening ahead. Thus far, the Fed Funds futures are pointing to a 75 bp in the upcoming meeting, with another 50 bp hike in September. Sticking to these expectations and a display of lesser pressure on their tightening grip ahead may underpin gold prices in the near-term. The yellow metal has been trading within a descending channel pattern since March this year. The US$1,768 level will be a key resistance to overcome, where the upper channel trendline coincides with a key 76.4% Fibonacci retracement level.
 Source: IG charts
Friday: DJIA -0.43%; S&P 500 -0.93%; Nasdaq -1.87%, DAX +0.05%, FTSE +0.08%


.jpeg.98f0cfe51803b4af23bc6b06b29ba6ff.jpeg)


0 Comments
Recommended Comments
There are no comments to display.
Create an account or sign in to comment
You need to be a member in order to leave a comment
Create an account
Sign up for a new account in our community. It's easy!
Register a new accountSign in
Already have an account? Sign in here.
Sign In Now