How will easyJet shares compare to Ryanair’s post Q3 trading statement?

Entry posted by ArvinIG in Analyst article
830 views
Where to next for the easyJet share price as Ryanair posts its first post-pandemic profit?

Source: Bloomberg
Ryanair posts first post-pandemic profit
On Monday Ryanair Holdings PLC (LSE) presented its results for the first quarter (Q1) of its fiscal year 2022 in which the airline reported a net profit of £170 million, its first post-Covid-19 pandemic profit.
The company’s chief executive officer, Michael O’Leary, said he is confident of a full earnings recovery, but is unsure whether that positive result will come in 2023 or 2024 as the war in Ukraine, soaring operating costs, the volatility in the price of jet fuel, recession fears and the latent threat of new Covid-19 restrictions make it difficult to make projections.
Ryanair's chief financial officer, Neil Sorahan, said the airline will focus on reducing debt over the next two years rather than paying dividends which didn’t go down well with investors and led to an initial drop in Ryanair’s share price. He also stated that "air traffic control disruptions all across Europe" represent the biggest hurdle for the firm, with staffing failures across airports and air navigation service providers stifling the ability to deliver on resurgent demand.
While many expect to see a strong bounce back for airlines once these post-lockdown issues are ironed out, investors will also be wary over the potential demand implications for Ryanair once inflationary pressures drive their pricing out of the ‘budget’ category.
Will easyJet follow Ryanair and swing into profit?
According to Refinitiv Eikon five out of 21 analysts polled see easyJet PLC as a strong buy, 11 a buy, two a hold and two a strong sell, which makes its share still a buy on average with a median price target of 650 pence, 71% above current levels (as of 25 July 2022).

Source: Refinitiv
With the airline having axed thousands of flights in recent months, including many on the day they were scheduled to depart, easyJet has often been mentioned in the press and not for the right reasons.
At the beginning of the month, the airline’s chief operating officer, Peter Bellew, was forced to resign amid growing anger over last minute flight cancellations. He had only been at the company since 2019, having previously held the same role at Ryanair.
With easyJet's reputation having taken a beating and travellers being put off by stories of lost luggage, long security queues and delayed flights, it isn’t clear whether easyJet can swing back into the black at its third quarter (Q3) trading statement, out Tuesday.
Technical outlook for easyJet
easyJet's share price declined by around 38% year-to-date compared to Ryanair’s 31% and in early July fell to 338.2p, to a level last seen in March 2012, and thus below its pandemic low.
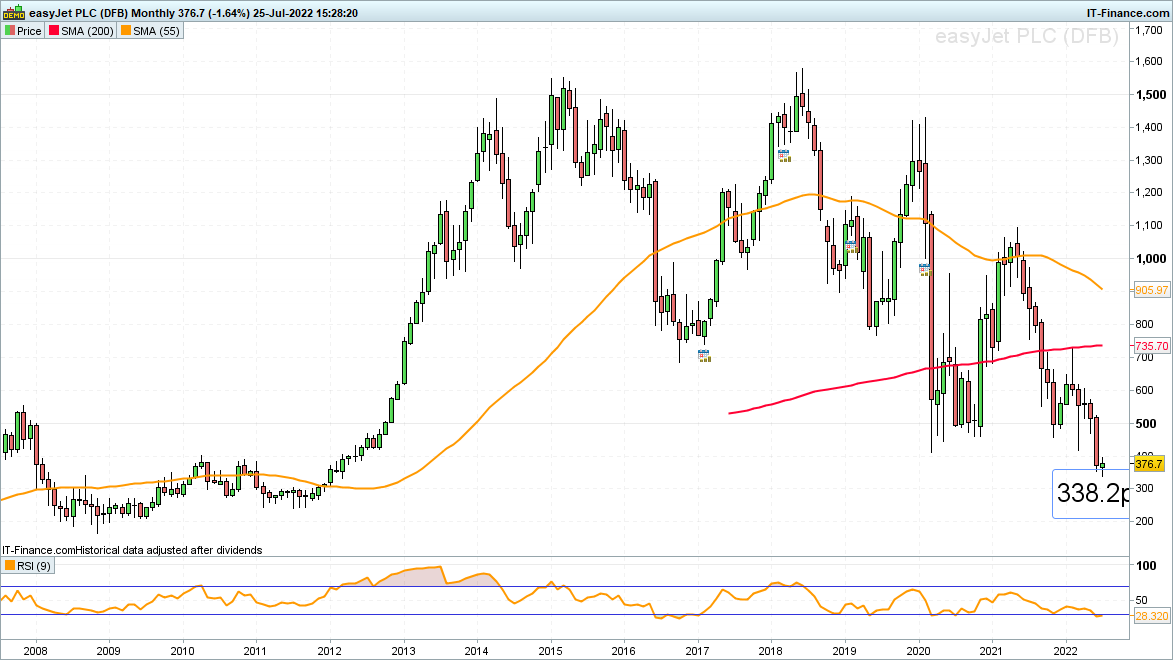
Source: TradingView and ProRealTime
Since the recovery from the 338.2p low looks like an Elliott wave A, B, C zigzag correction, and, as such, is corrective in nature, the odds favour a continuation in the easyJet share price’s descent as long as no unexpected bullish reversal takes it above the 21 June high at 448.6p.
A drop below the 338.2p recent low would target the psychological 300p mark and perhaps even the April and July 2011 lows at 268.5p to 252.7p.
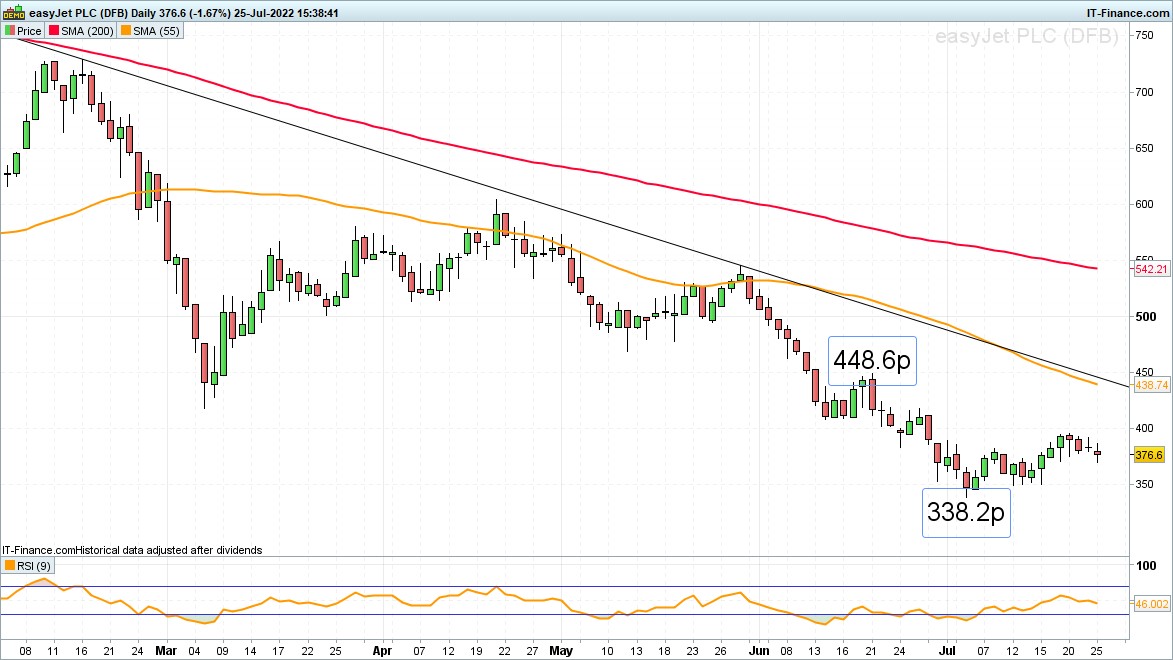
Source: TradingView and ProRealTime


.jpeg.98f0cfe51803b4af23bc6b06b29ba6ff.jpeg)


0 Comments
Recommended Comments
There are no comments to display.
Create an account or sign in to comment
You need to be a member in order to leave a comment
Create an account
Sign up for a new account in our community. It's easy!
Register a new accountSign in
Already have an account? Sign in here.
Sign In Now