EUR/USD, GBP/USD and AUD/USD reverse lower but recent uptrend remains

Entry posted by ArvinIG in Analyst Article
609 views
EUR/USD, GBP/USD, and AUD/USD turn lower, but the uptrend seen over the course of the past month brings the potential for another upward move before too long.
EUR/USD falls back into confluence of support
EUR/USD has been on the back foot over the course of recent trading days, with the price retracing from Wednesday’s peak to fall back into trendline support.
The upward trend seen over the course of the past month does still remain intact, with this pullback taking us into a zone that could see the price reverse upwards once again here.
As such, the confluence of the 61.8% Fibonacci retracement, 200-simple moving average (SMA), 100-SMA, and trendline support all provide the basis for a potential upward turn from here. A break back below the $1.0122 support level would be required to negate that current uptrend seen over the course of the past month.
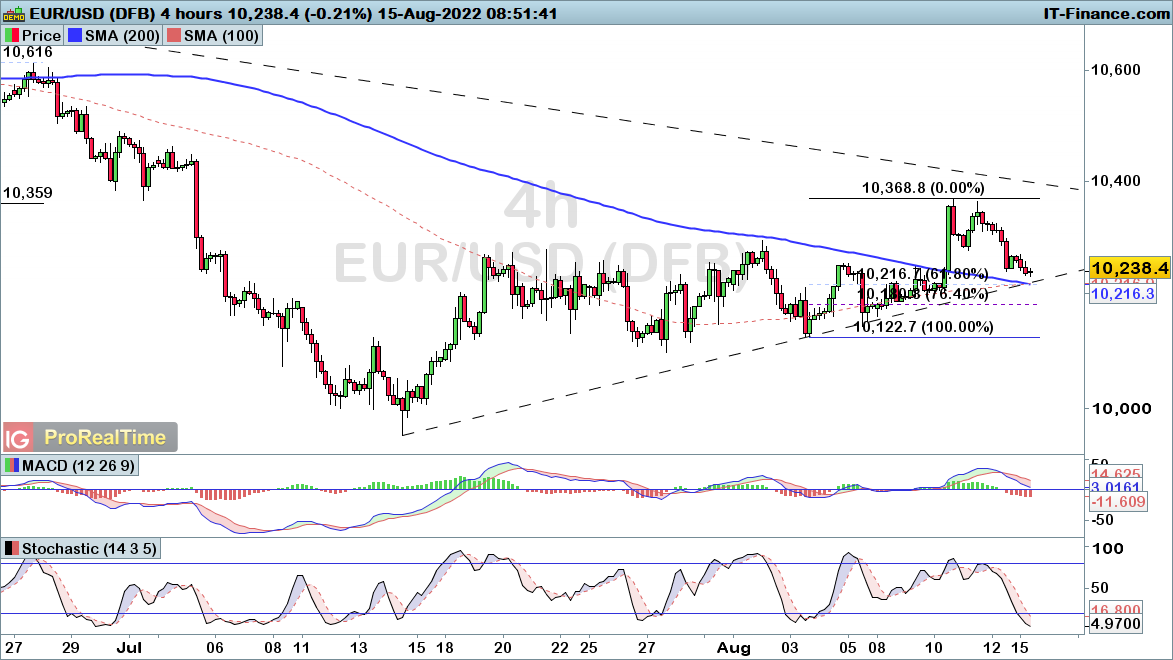
Source: ProRealTime
GBP/USD drops back into trendline support
GBP/USD has similarly been reversing lower off the back of Wednesdays US consumer price index (CPI) reading, with the price heading back into trendline support this morning.
Unlike EUR/USD, we have seen this latest high come in below the prior peak of $1.2293, thus raising the potential for a bearish reversal if we see the price break lower.
With trendline support coming into play here, there is a good chance we see the bulls come back into play from here. A break back below the likes of $1.2063 and $1.20 would be required to bring greater confidence that the bears are back in charge.

Source: ProRealTime
AUD/USD turns lower from 76.4% Fibonacci resistance
AUD/USD managed to outperform over the course of the past week, with the price rising into a fresh two-month high on Thursday. However, we are seeing the price reverse lower this morning, with Australian growth prospects dented by a raft of disappointing Chinese data points earlier this morning.
We are subsequently seeing the price fall back into the first support level of $0.7063 after reaching the 76.4% Fibonacci resistance level at $0.7141.
The ability to break back below $0.7063 would signal the potential for a wider pullback for the pair, with the 100-SMA and Fibonacci levels ($0.6992 and $0.702) bringing possible downside targets if we do see that breakdown. Below that, we would need to see a move below $0.6948 to negate the bullish trend that has been playing out over the course of the past month.

Source: ProRealTime


.jpeg.98f0cfe51803b4af23bc6b06b29ba6ff.jpeg)


0 Comments
Recommended Comments
There are no comments to display.
Create an account or sign in to comment
You need to be a member in order to leave a comment
Create an account
Sign up for a new account in our community. It's easy!
Register a new accountSign in
Already have an account? Sign in here.
Sign In Now