Global equity markets: Dow Jones, US Dollar, ECB, BOC, RBA
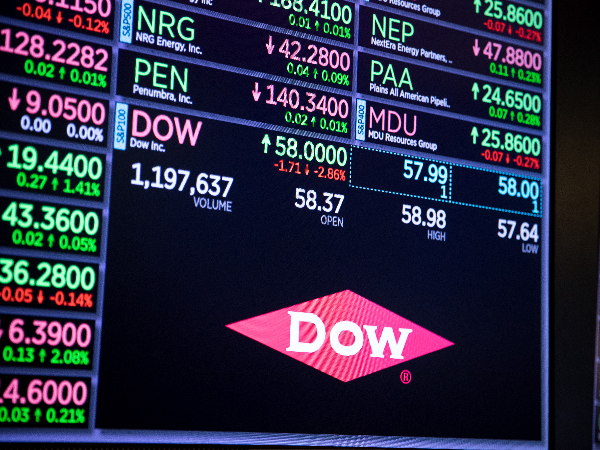
Global equity markets tumbled last week, sending risk assets and gold prices lower. Central bank event risks fill the docket for the week, offering traders volatility.

Source: Bloomberg
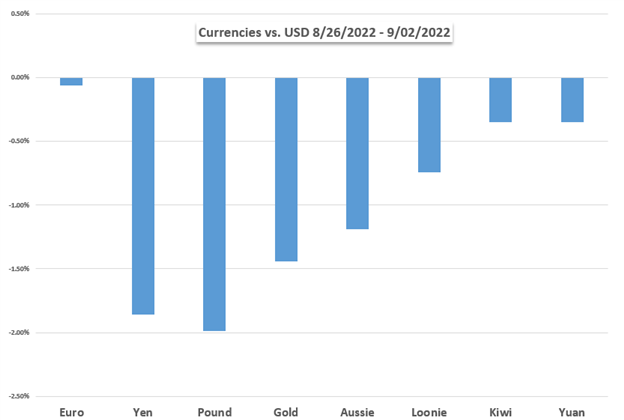
Global equity markets closed the week with steep losses as traders shifted their money out of risk assets, worried by economic concerns and inflation-focused central banks that appear ready to continue tackling high prices even if it induces recessions. US stocks opened higher on Friday after the US non-farm payrolls report crossed the wires, which showed a gain of 315,000 jobs in August. That was slightly above the 315k Bloomberg consensus forecast, although wages didn’t rise as much as expected. The wage data was encouraging for the US inflation outlook, which weighed on gold-friendly breakeven rates. XAU/USD rose on Friday, but the yellow metal traded almost 1.5% lower throughout the week.
The cooling wage growth helped ease the Fed’s perceived rate path. Traders appeared wary of holding risk over the long US holiday weekend. Yields across the Euro Area rocketed higher as bond traders ditched European debt. The European Central Bank is expected to deliver a 75-basis point rate hike at next Thursday’s policy meeting, with overnight index swaps (OIS) showing a 62.8% chance for the jumbo hike.
Dutch European natural gas prices plummeted on Friday, bringing the total weekly loss to nearly 40% as supply fears eased. According to GIE’s AGSI data, the European Union’s gas storage rose to over 80% as of August 31, putting the 27-member bloc on pace to hit its storage targets before the winter, when energy demand will increase. The ECB’s incoming rate hike is seen as tempering demand.
Risks remain. Russia’s Gazprom, on Friday, said it would not resume operations of the Nord Stream 1 Pipeline, a critical artery for Europe’s energy. The Russian state-backed energy company cited technical issues in extending the outage that started on Wednesday. Those issues may slow Europe’s progress on increasing storage, especially if flows don’t restart, which is a possibility that markets should consider.
The Canadian dollar fell against the Greenback, with the Loonie weighed down by falling crude oil prices. USD/CAD was looking at its highest daily close since November 2020 during Friday trading. The Bank of Canada is seen raising its benchmark lending rate to 3.25%, according to cash market pricing. That would bring the BoC’s rate above what BoC Governor Tiff Macklem sees as the neutral rate (2%-3%). That said, Canada’s economy is likely to suffer, given the rate would be above neutral assuming a 75-bps hike does occur. The Canadian dollar is likely primed for further losses outside of a large recovery in oil prices.
Elsewhere, the Reserve Bank of Australia (RBA) is set to deliver an interest rate decision on September 6. The Australian dollar fell around 1% last week as iron ore prices in China fell almost 10%, bringing the metal ore to its lowest level since November 2021. Rate traders have eased bets for continued aggression from the Australian central bank beyond next week’s meeting, which is expected to see a 50-bps hike. However, with the country’s inflation rate still well above target at 6.1%, the RBA may have to deliver an increase in its pace of tightening. China remains a massive headwind for Australia and the broader APAC region. Several cities locked down last week as Covid-19 cases increased.
US dollar performance vs. currencies and gold

Source: DailyFX
This information has been prepared by DailyFX, the partner site of IG offering leading forex news and analysis. In addition to the disclaimer below, the material on this page does not contain a record of our trading prices, or an offer of, or solicitation for, a transaction in any financial instrument. IG accepts no responsibility for any use that may be made of these comments and for any consequences that result. No representation or warranty is given as to the accuracy or completeness of this information. Consequently any person acting on it does so entirely at their own risk. Any research provided does not have regard to the specific investment objectives, financial situation and needs of any specific person who may receive it. It has not been prepared in accordance with legal requirements designed to promote the independence of investment research and as such is considered to be a marketing communication. Although we are not specifically constrained from dealing ahead of our recommendations we do not seek to take advantage of them before they are provided to our clients.
Thomas Westwater | Analyst, DailyFX, New York City
05 September 2022


.jpeg.98f0cfe51803b4af23bc6b06b29ba6ff.jpeg)

0 Comments
Recommended Comments
There are no comments to display.
Create an account or sign in to comment
You need to be a member in order to leave a comment
Create an account
Sign up for a new account in our community. It's easy!
Register a new accountSign in
Already have an account? Sign in here.
Sign In Now