Oil prices in oversold territory on G7 price cap and despite OPEC+ supply curbs

Entry posted by MongiIG in Market News
851 views
Are WTI and Brent crude oil prices a trading opportunity as they move to oversold territory after G7 and OPEC+ news?
 Source: Bloomberg
Oil price lower despite OPEC+ looking to tighten supply
Oil prices have continued to drift lower, despite recent news that the Organisation of Petroleum Exporting Countries (OPEC) and its allies (OPEC+) will look to reduce output by 100 000 barrels per day in October this year.
The fall in oil (following the news) is perhaps a suggestion that markets had already priced in a larger curb to production than was announced.
G7 agree to price cap on Russian oil
The Group of Seven (G7), which includes political representatives from nations Canada, France, Germany, Italy, Japan, the United Kingdom and the United States, have recently agreed to an oil price cap scheme.
The aim of the scheme is to inhibit Russia’s profitability from oil, adding to embargoes already and soon to be (EU) implemented. The price looks to limit insurers and shipping companies from distributing the commodity unless the oil is purchased below certain thresholds. G7 nations control roughly 90% of the global shipping insurance market.
G7 nations will further look for the support of countries such as India and China. China is currently the largest importer of Russian oil.
Russia’s threats of retailiation
Russian president Vladimir Putin has warned that Russia could halt oil and gas supplies in the event that price caps are implemented against the regions exports. The news has been met with a marginal rebound in oil prices.
Electricity needs to increase demand for oil
Rampant energy costs, relating to fossil fuels such as coal and natural gas, are seeing the increased need for oil to help with electricity generation. This could provide some support prices over the short to medium term.
Brent Crude – Technical view
 Source: IG Charts
The price of brent crude oil continues to trade in a broad rangebound environment. The price is currently looking oversold near the support of this range at 8850.
Traders looking for long entry might hope to see a bullish price reversal from current with a strong close back above the 9285 level. In this scenario, 9890 would be the initial upside target from the move, while a close below either the reversal low or 8850 level might be used as a stop loss indication.
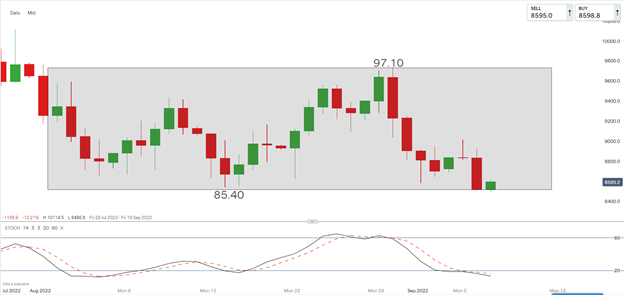
US Crude (WTI) – Technical view
 Source: IG Charts
The price of US crude is also trading within a rangebound environment. The price is currently looking oversold near the support of this range at 8540.
Traders looking for long entry might hope to see a bullish price reversal from current with a strong close back above the midpoint of the preceding long bodied candle (6th of September). In this scenario, 9000 would be the initial upside target from the move, while a close below the reversal low might be used as a stop loss indication.
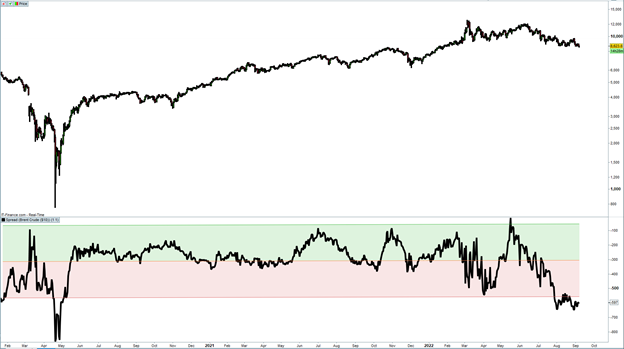
WTI vs Brent
 Source: IG Charts
The above chart shows a WTI (US) crude oil chart and spread comparison indication against Brent crude. The spread indicator trading below the red shaded area on the chart shows that the price of WTI has seen a sharp underperformance (more than two standard deviations) against its Brent crude peer. This is only the second time this has occurred in the last two and a half years.
The suggestion from the spread comparison is that over the medium term we could see a normalization of the relationship between these two securities with WTI now starting to outperform Brent.
An outperformance could occur in one of three ways:
- The price of WTI rising while the price of Brent falls
- The price of WTI rising faster than the price of Brent rising
- The price of WTI falling slower than the price of Brent falling


.jpeg.98f0cfe51803b4af23bc6b06b29ba6ff.jpeg)


0 Comments
Recommended Comments
There are no comments to display.
Create an account or sign in to comment
You need to be a member in order to leave a comment
Create an account
Sign up for a new account in our community. It's easy!
Register a new accountSign in
Already have an account? Sign in here.
Sign In Now