Market alert: Euro gains some traction on US dollar lull ahead of the ECB

Entry posted by ArvinIG in Analyst article
492 views
The euro has had some reprieve against a staunch US dollar; a hawkish ECB might suit the euro against the Japanese yen and if the ECB raises rates by 75 bp today, where will it send EUR/USD?
Source: Bloomberg
The EUR has found some strength going into today’s European Central Bank (ECB) meeting after better-than-expected euro wide GDP figures yesterday. The final annualised GDP of 4.1% to the end of July beat forecasts of 3.9%.
The ECB is anticipated to raise rates by 75 basis points according to a Bloomberg survey of economists. The overnight index swaps (OIS) market is slightly less convinced, pricing in a lift of around 67 bps.
Central banks globally are tightening to rein in runaway inflation with the Reserve Bank of Australia (RBA) and the Bank of Canada (BoC) already raising rates this week.
The Federal Reserve have made it clear that they are serious about tackling price pressures. Yesterday we heard from Federal Reserve Bank of Cleveland President Loretta Mester and Federal Reserve Vice Chair Lael Brainard. They both reiterated their hawkish stance.
They presented a view from within the Fed that rates will be notably higher and a cut in 2023 is not currently on the cards. This has pushed Treasury yields across the curve to levels not seen for many years. The two-year note traded at 3.55% overnight, a yield not seen since before the financial crisis in 2007.
Higher Treasury yields has helped to underpin the US dollar more broadly and EUR/USD has been under pressure for some time. A problem for the ECB in their fight on inflation is the fragile economic state of the union.
The Russian invasion of Ukraine has placed enormous strain on energy supply. The benchmark Dutch Title Transfer Facility (TTF) natural gas futures contract has pulled back from astronomical highs seen in August but remains significantly elevated.
Until late 2021, the contract rarely traded above 25 euro per Mega Watt hour (MWh). In August it hit a peak of 342 euro per MWh and is trading near 220 euro per MWh.
While this is a welcome retracement, at this stage it doesn’t appear to be enough to move the dial on EU CPI expectations. Last week, EU PPI printed at 37.9% year-on-year to the end of July. The lead-lag effect of PPI into CPI is well understood by central banks and the ECB raising rates today might be joined by several more down the track.
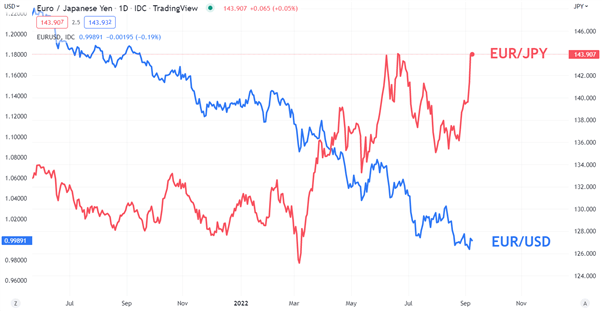
Elsewhere, EUR/JPY is nearing a seven-year high as Japan grapple with their own economic problems. The island nation depends on importing energy and face a similar problem to Europe in that regard.
Additionally, the Bank of Japan (BoJ) are swimming against the tightening tide and doubled down on their yield curve control program (YCC) this week, maintaining loose monetary policy.
A hike from the ECB looks to be playing catch up to the Fed but it would widen a gap with the BoJ. A difference of reaction in EUR/USD and EUR/JPY could reflect that disparity.
EUR/USD versus EUR/JPY
This information has been prepared by DailyFX, the partner site of IG offering leading forex news and analysis. In addition to the disclaimer below, the material on this page does not contain a record of our trading prices, or an offer of, or solicitation for, a transaction in any financial instrument. IG accepts no responsibility for any use that may be made of these comments and for any consequences that result. No representation or warranty is given as to the accuracy or completeness of this information. Consequently any person acting on it does so entirely at their own risk. Any research provided does not have regard to the specific investment objectives, financial situation and needs of any specific person who may receive it. It has not been prepared in accordance with legal requirements designed to promote the independence of investment research and as such is considered to be a marketing communication. Although we are not specifically constrained from dealing ahead of our recommendations we do not seek to take advantage of them before they are provided to our clients.


.jpeg.98f0cfe51803b4af23bc6b06b29ba6ff.jpeg)


0 Comments
Recommended Comments
There are no comments to display.
Create an account or sign in to comment
You need to be a member in order to leave a comment
Create an account
Sign up for a new account in our community. It's easy!
Register a new accountSign in
Already have an account? Sign in here.
Sign In Now