Hotter US job data reverses relief rally: SPDR S&P Semiconductor ETF, ASX200, AUD/JPY
A hotter-than-expected US job data last Friday pushed back hopes of a policy pivot from the Fed once more, with the US adding more jobs than expected while unemployment rate provided a downside surprise at 3.5%.
 Source: Bloomberg
Market Recap
A hotter-than-expected US job data last Friday pushed back hopes of a policy pivot from the Federal Reserve (Fed) once more, with the US adding more jobs than expected (263,000 versus 250,000 consensus) while unemployment rate provided a downside surprise at 3.5% (expected 3.7%). Although there were some pockets of optimism in the lower-than-expected wage growth (5.0% year-on-year versus 5.1% forecast) and slight downtick in participation rate, overall data maintained the ongoing tightness in the US labour market, which firmed up the Fed’s tightening outlook. To top it off are comments from the Fed vice-chair John Williams, who echoed other Fed officials in calling for a rise in interest rates to around 4.5% over time.
With that, market pricing currently points to an almost-certain 75 basis-point (bp) hike in the November Federal Open Market Committee (FOMC) meeting. There has also been an upward revision in longer-term rate hike expectations, with some surfacing bets of another 75 bp rate hike for the December meeting, something which was not presented before the US job data release. This provided the go-ahead to warrant a broad-based move to the upside for US Treasuries yields, which translated to downside for equities and prompted a more negative reaction from the rate-sensitive Nasdaq (-3.80%). The US dollar also anchored a new higher low and retained its overall upward bias. Oil prices managed to shrug off the US dollar strength with a 4% move higher, still riding on optimism from the Organization of the Petroleum Exporting Countries Plus (OPEC+) production cuts.
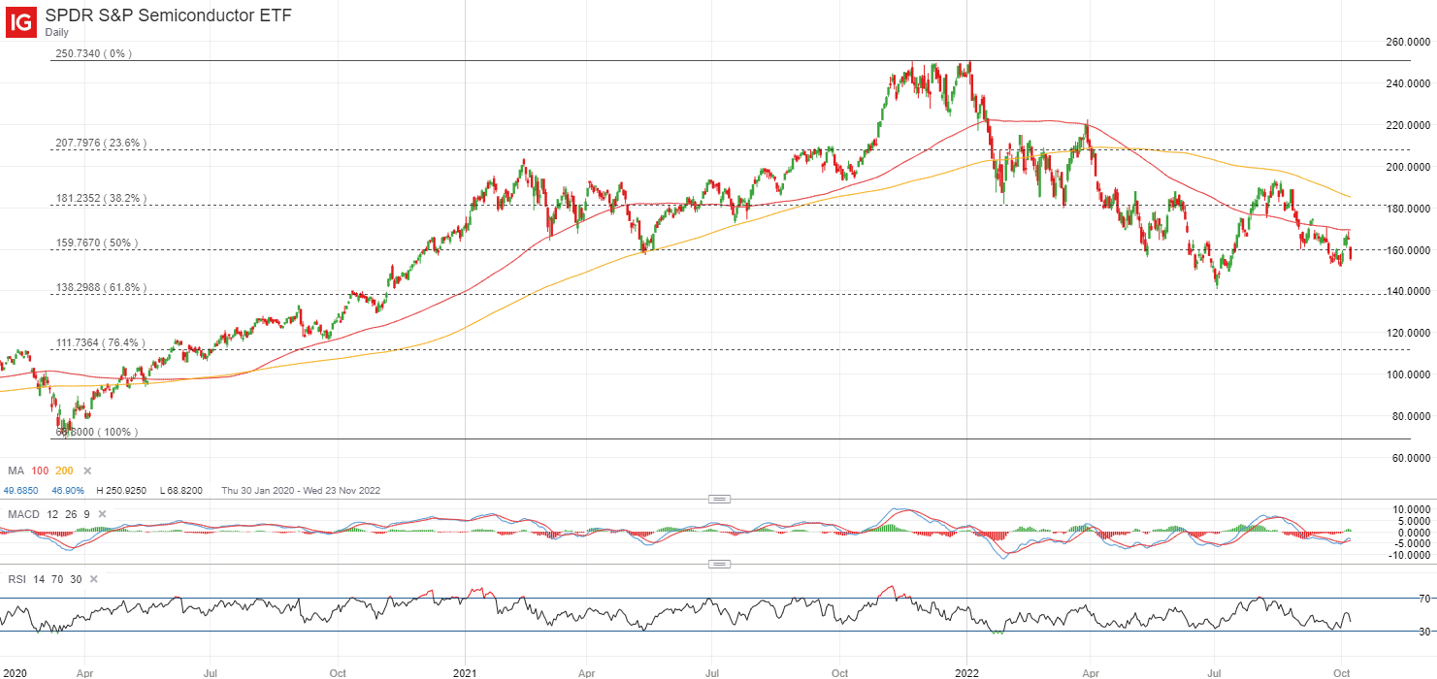
The week ahead provided a series of hurdles to overcome once more, with the release of the FOMC minutes, US Consumer Price Index (CPI) and kickstart of US earnings season. While the trend may be towards further moderation in headline inflation, the core CPI is expected to move higher to 6.5% from previous 6.3% and markets had previously shown to react negatively to the more persistent core pricing pressures. Any outperformance in the inflation readings could bring chatters of 5% rate on the table ahead, especially coming after the recent strong job data. On the corporate front, the semiconductor sector is put in the limelight, as a quicker-than-expected moderation in demand drove AMD to cut its sales guidance, following a 32% dive in Samsung Electronics’ third quarter (Q3) operating income. The recent rebound in the semiconductor has proved to be short-lived, with the SPDR S&P Semiconductor ETF rejecting its 100-day moving average (MA). A bearish pin bar was displayed on its weekly chart, with a close below previous dip-buying level at 156.60. With the overall trend remaining downward bias, this could drive a retest of its July bottom at the 141.80 level next as we head into the earnings season, where the weaker-demand story could be reiterated.
 Source: IG charts
Asia Open
Asian stocks look set for a negative open, with ASX -1.29% and NZX -1.51% at the time of writing. Markets in Japan, South Korea, Taiwan are closed today, which may lead to a reduced-volume trading session, while the negative momentum from last week may initiate a push lower in the region. The US Treasuries market is closed today as well, removing the catalyst of bond yield movement in driving sentiments for now. China markets are back online after its week-long holiday break, with sentiments having to digest the initial strength in global indices at the start of last week before the risk environment took a turn with the US job data. The release of China’s Caixin services Purchasing Managers' Index (PMI) for September also provided little reason to cheer, with the reading headed into contractionary territory for the first time since May and added to the list of concerns that more may need to be done by authorities to lift growth. Further set of export controls to cut China off from certain semiconductor chips continued to reveal the tensions between US-China relations, leaving the growth outlook on the tech sector in question.
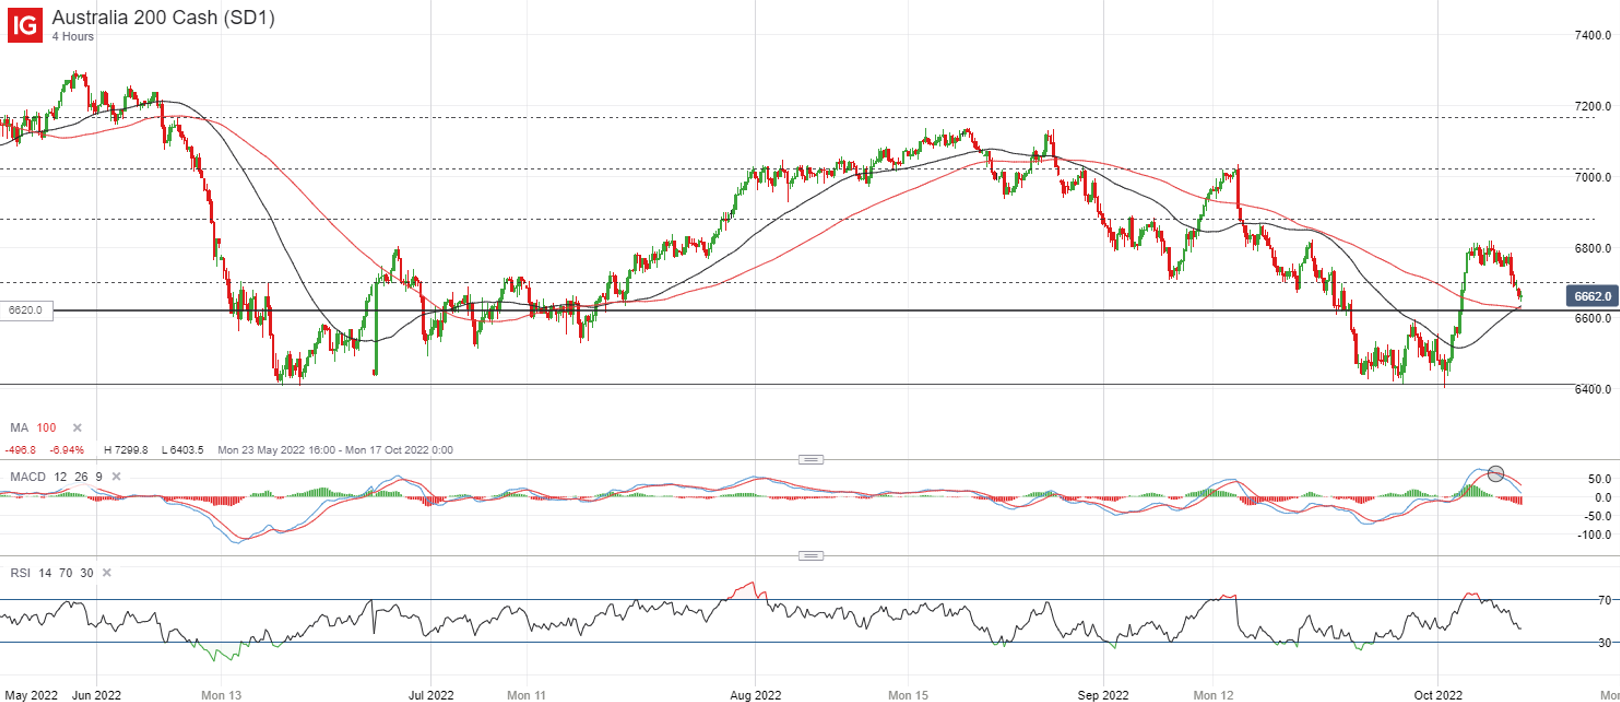
For the ASX200, a break below a key 23.6% Fibonacci retracement level leaves the 6,620 on close watch. This level is where a confluence of its 50-period and 100-period MA stands and a breakdown below the level could leave the previous lows at the 6,400 level in sight next.
 Source: IG charts
On the watchlist: Bearish flag in AUD/JPY points to further downside ahead?
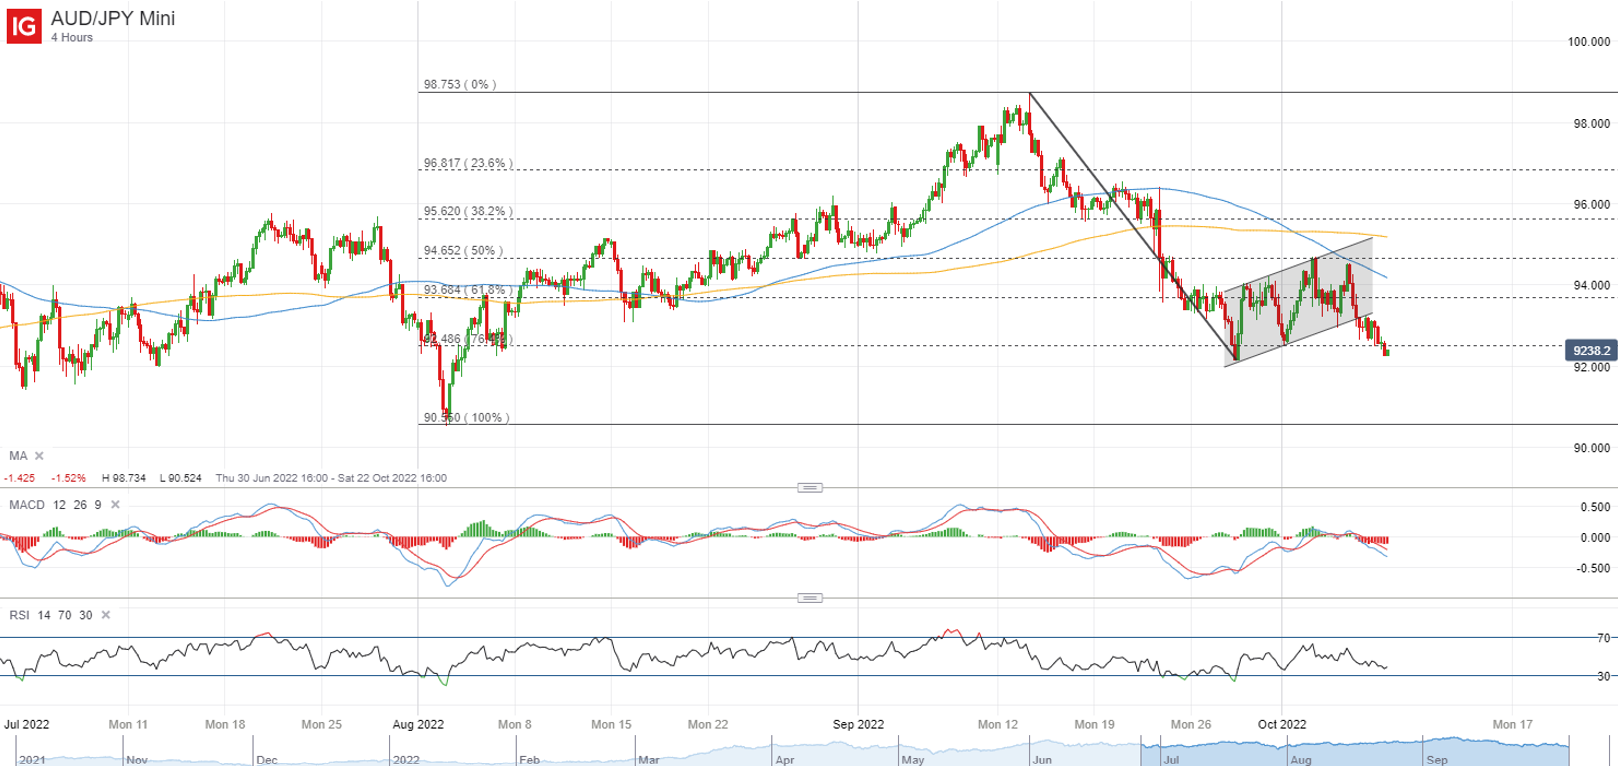
The reversal in risk environment towards the end of last week seems to bring about a break below a bearish flag pattern for the AUD/JPY as reflected on its four-hour chart, with the pair pushing to a one-week low. This seems to place the pair on track to retest its September bottom, after multiple bearish rejections of its 100-day MA last week. A series of hurdles may lie ahead for the risk environment this week, including the US CPI, FOMC minutes and kickstart of US earnings season. For now, momentum remains tilted to the downside in the near term and any downward break of the 92.00 level will be on watch to potentially carry further downward move to the 90.55 level next.
 Source: IG charts
Friday: DJIA -2.11%; S&P 500 -2.80%; Nasdaq -3.80%, DAX -1.59%, FTSE -0.09%


0 Comments
Recommended Comments
There are no comments to display.
Create an account or sign in to comment
You need to be a member in order to leave a comment
Create an account
Sign up for a new account in our community. It's easy!
Register a new accountSign in
Already have an account? Sign in here.
Sign In Now