FOMC preview: Inflation continues to push the Fed into oversized rate hikes

Entry posted by MongiIG in Market News
276 views
The Federal Reserve are likely to raise rates by 75-basis points, but volatility looks likely as we look for signals of where rates will end up.
 Source: Bloomberg
The FOMC look set to provide their latest monetary policy statement this Wednesday, coming on a week that also sees the RBA and BoE decisions on Tuesday and Thursday respectively. The two-day FOMC meeting concludes on Wednesday 2 November 2022. Inflation remains the key concern, but the slowing rate of hikes from the likes of the RBA and BoC do provide a growing theme as we approach so-called terminal rates. Quite whether the Fed will follow suit remains to be seen.
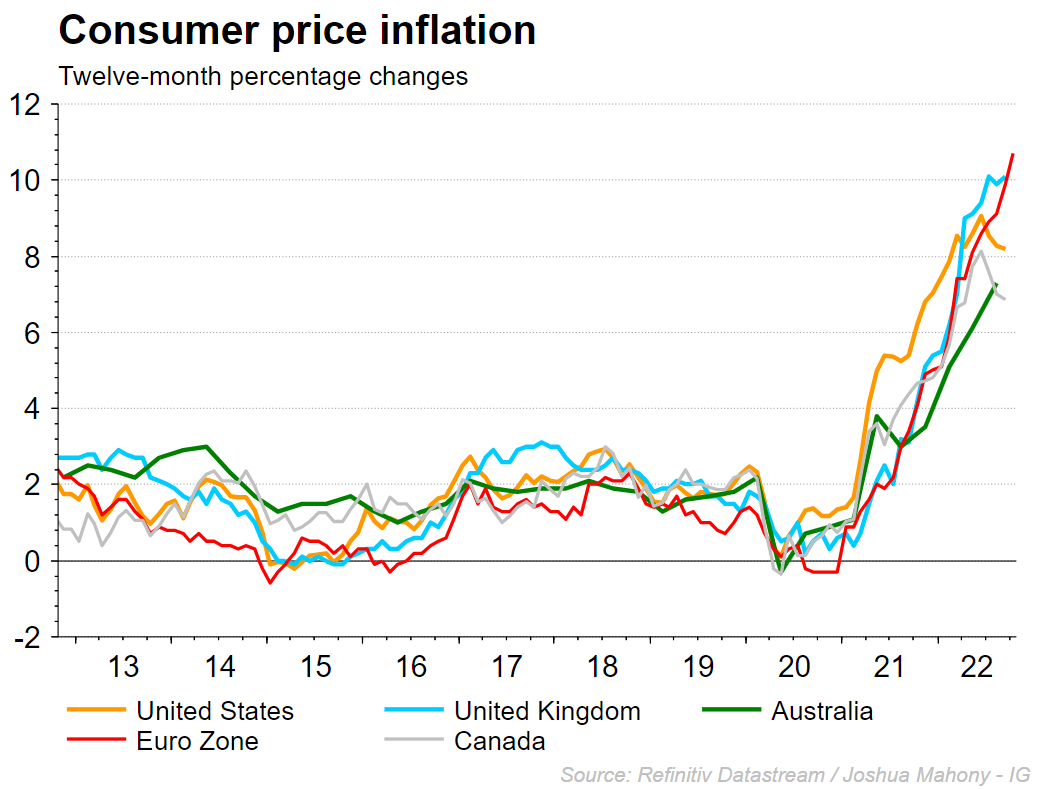
Inflation concerns remains despite recent decline
Inflation is the primary concern for the Federal Reserve, with the committee desperate to drive down prices as quickly as possible. The latest annual CPI figure of 8.2% does represent a figure significantly below the 10.7% announced from the eurozone. However, it remains a long way from the 2% target. The chart below highlights how we have seen US price growth dip since the June peak.
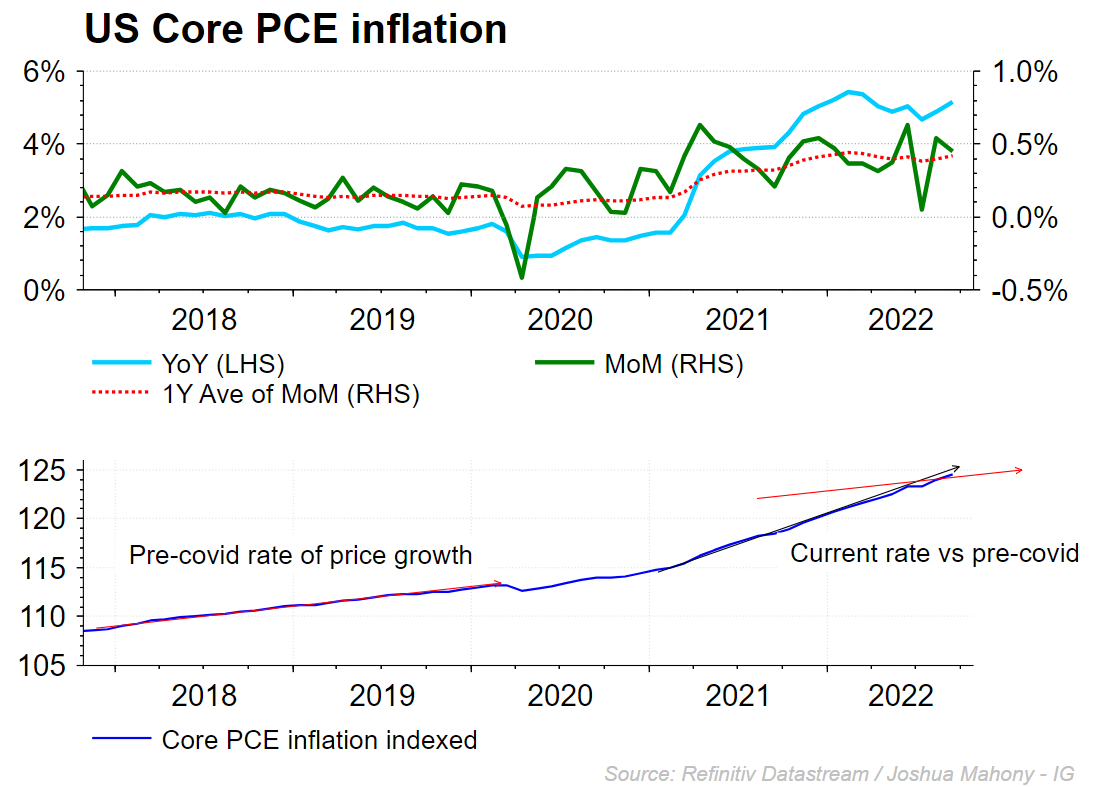
Looking into the US inflation data, we can see that the Fed’s preferred measure (core PCE) continues to tell a different story. The red dotted line highlights how the monthly PCE gains average 0.4% compares with the 0.15% figure seen pre-covid. The rate of ascent in underlying inflation has shifted onto a steeper pace as seen on the lower section. Until we see that pace turn down onto the red line, we are likely to see prices remain elevated even if energy continues to come off. The flip side of this is that wecould see energy prices move higher, which would likely bring another bout of inflation, restraining the Fed from reversing this tightening phase.
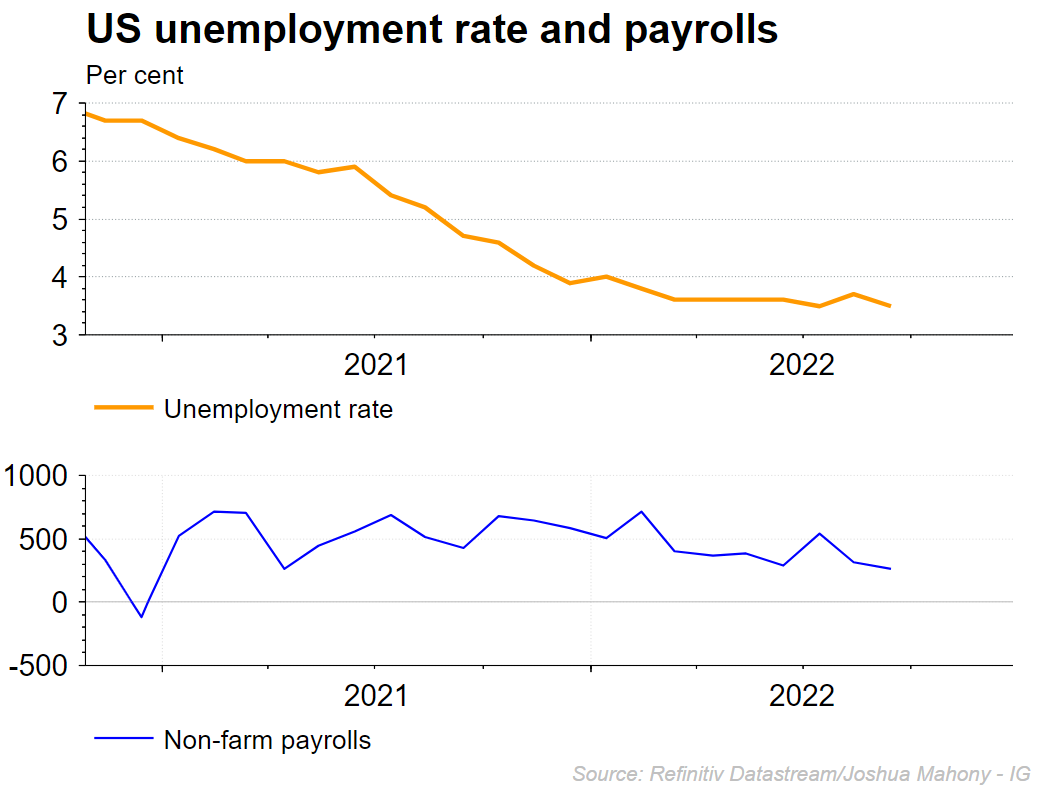
Jobs market gives no cause for concern
From an employment perspective, the Fed seemingly have little to worry about as things stand. While higher prices and increased interest rates bring concerns over the potential economic implications, that has not brought any negative impact on the unemployment rate or non-farm payrolls thus far.
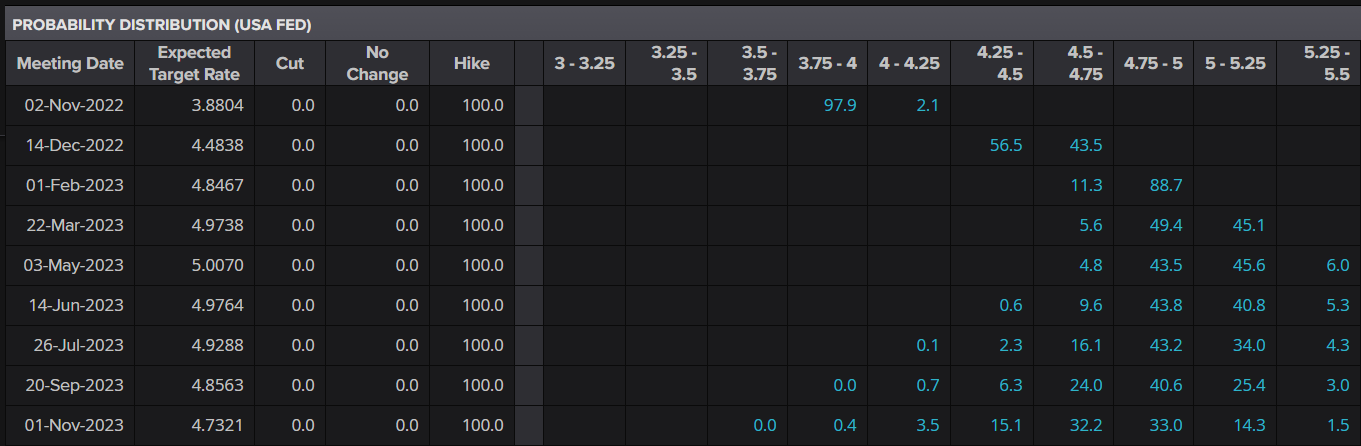
What to expect from the Fed
The Federal Reserve are widely expected to enact another oversized 75-basis point rate hike on Wednesday, bringing the headline Fed funds target rate to 4%. Markets are pricing in a 98% chance of such a move, with the remaining 2% pricing in a 100bp rise. There are some who are speculating that the Fed could slow their pace up hikes by raising by just 50bp, but markets are currently not pricing in such a move. That would mean that a 50bp hike could bring significant volatility for markets. The table below highlights how markets are expecting to see rates rise and settle around the 4.75-5.25 band in mid-2023.
 Source: Eikon
Markets are likely to remain highly sensitive to the pace of change for rates, with any signals that would divert us from this pace likely to bring volatility. Thus keep an eye out for any signals over where the Fed see rates settling down, and how long it may take to get there. Nonetheless, the most important aspect is likely to be how long we see rates elevated before they start to loosen policy once again. The Fed is not in the business of hurting the economy, and thus they will likely attempt to return to a more accommodative stance as soon as inflation allows.
Dollar index technical analysis
The dollar has come under pressure of late, with a rebound in equity markets serving to hurt the haven greenback. The dollar index highlights this move, with price falling back into the 109.02 support level. Crucially, that support level represents the 76.4% Fibonacci retracement of the latest 107.45-114.72 leg higher. We have also seen the stochastic move out of oversold, bringing a buy signal that has typically worked well for bulls in the three other occasions it occurred this year. With that in mind, bullish positions are favoured unless the index falls below the 107.45 swing-low.
 Source: ProRealTime


.jpeg.98f0cfe51803b4af23bc6b06b29ba6ff.jpeg)

0 Comments
Recommended Comments
There are no comments to display.
Create an account or sign in to comment
You need to be a member in order to leave a comment
Create an account
Sign up for a new account in our community. It's easy!
Register a new accountSign in
Already have an account? Sign in here.
Sign In Now