AUDNZD under pressure as the RBNZ prepare to quicken their pace of tightening

Entry posted by MongiIG in Market News
1,078 views
The RBNZ look set to ramp up their tightening pace, with the widening gap between Australian and New Zealand rates bringing expectations of further AUDNZD weakness
 Source: Bloomberg
NZD on the rise ahead of RBNZ rate decision
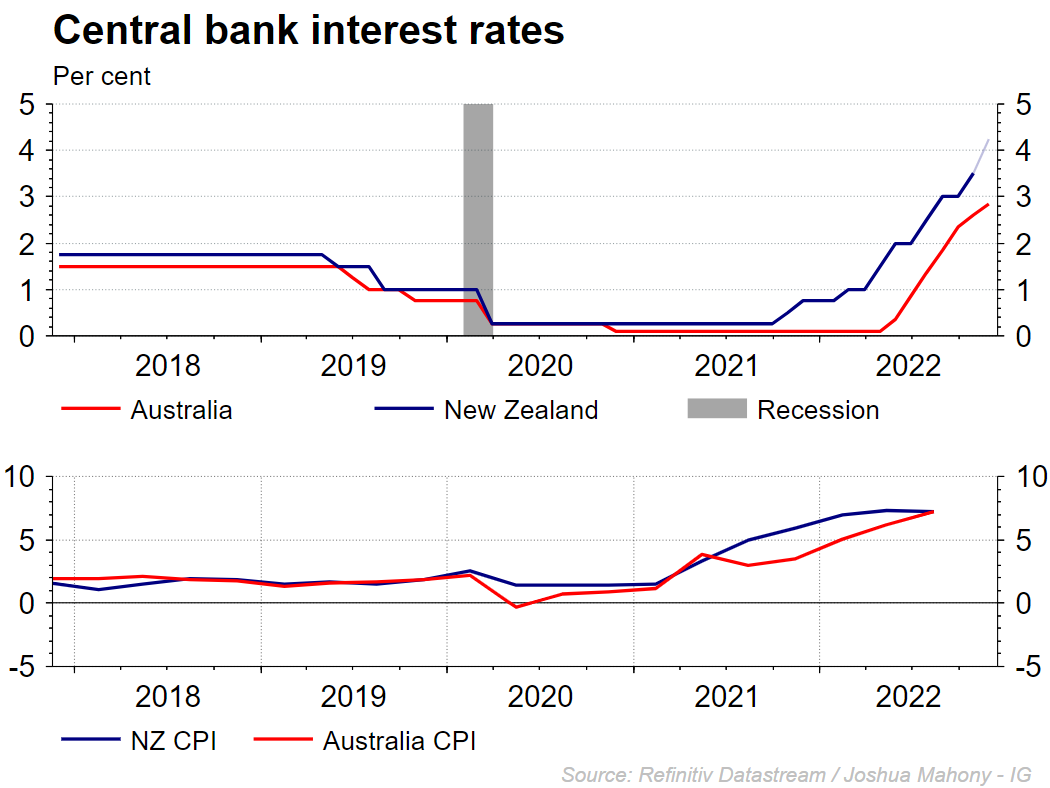
The New Zealand dollar has been outperforming its Antipodean counterpart over the past two-months, as the shifting outlook around interest rates help reverse a substantial AUDNZD rally in the first half of the year. This week sees that topic come back into play once again, as the RBNZ looks to implement a ninth consecutive rate hike. The size of that move will be key, as their Australian neighbors move to wind down their tightening phase. Both of their past rate hikes have come in at just 25-basis points. Meanwhile, New Zealand are currently primed for a 75-basis point hike that would represent a step-change from the 50bp moves seen in each of the past five-meetings. This disparity comes despite the fact that both countries have inflation around 7.3%.
 Source:
It is notable that Australian inflation does continue to move rapidly upwards compared with New Zealand prices which are starting to roll over somewhat. Whether that influences the RBA to ramp-up their pace of hikes once again remains to be seen. However, we are not at that point currently.
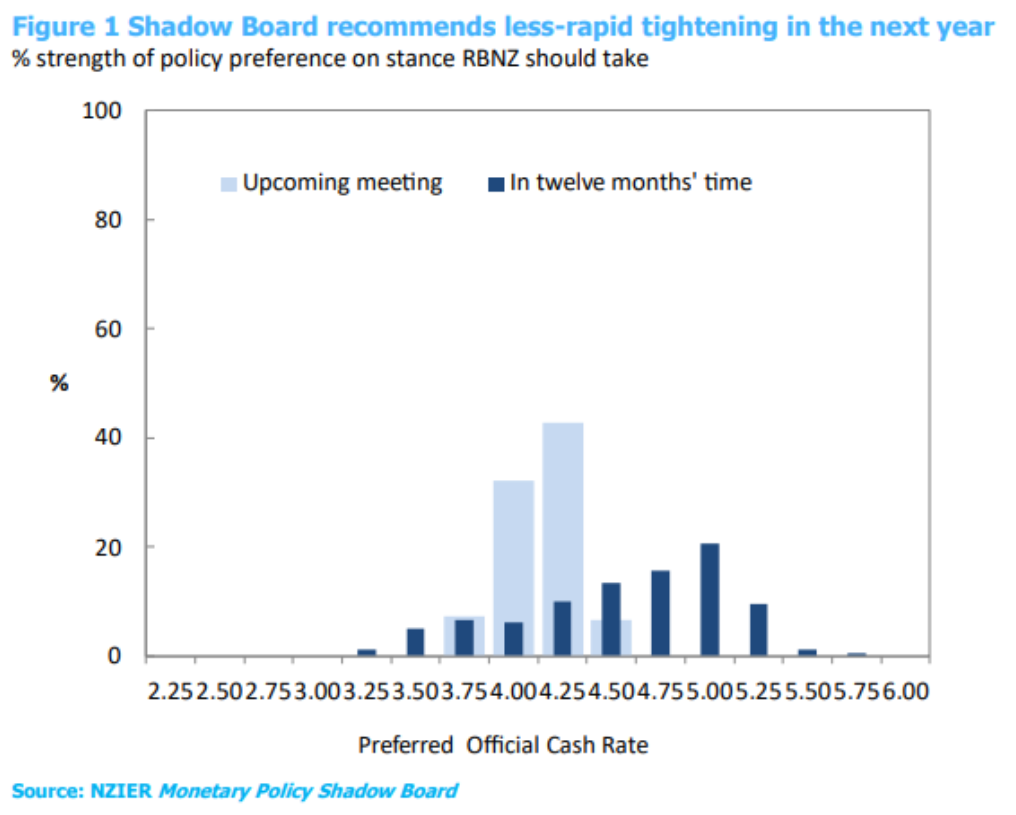
From a New Zealand perspective, it is worthwhile looking to the Institute of Economic Research (NZIER) shadow board, whose analysts predict a 75-basis point hike on Wednesday. The breakdown below highlights how rates are expected to slow down moving forward, with the board predicting a rate of 5% in 12-months’ time. Nonetheless, should we see an oversized hike on Wednesday, that quickening pace would likely drive AUDNZD lower given the approach from the RBA.
 Source: NZIER
AUDNZD collapses from historical resistance
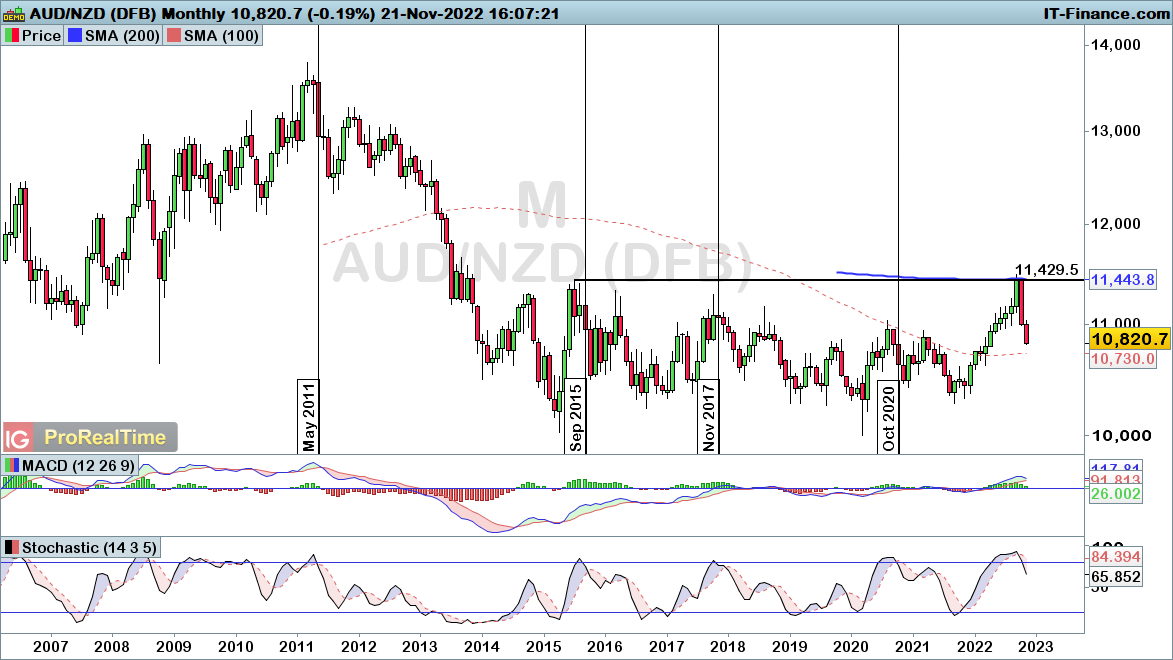
AUDNZD has seen huge downside since the September peak, with October particularly providing a massive bearish engulfing candlestick pattern. That reversal came from the confluence of the 200-SMA and 1.1429 resistance level that represents the top of a range respected for over eight-years now. We have also seen the stochastic break back below the 80 threshold, with that move out of overbought territory providing us with timely sell signals over the years. With that in mind, further downside looks likely to continue for the time being.
 Source: ProRealTime
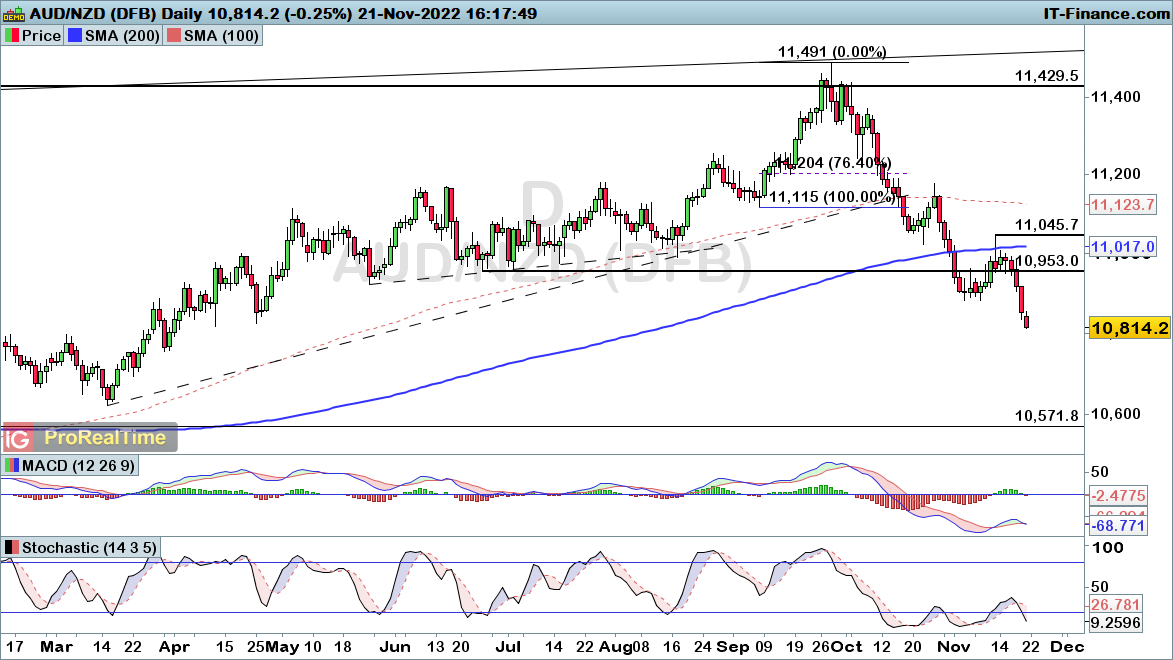
On the daily timeframe, the recent move lower brings about a fresh leg lower and signals the end of the recent upward retracement seen earlier this month. With that daily trend in play, we can expect further weakness unless price manages to break up through the 1.1045 swing-high.
 Source: ProRealTime


0 Comments
Recommended Comments
There are no comments to display.
Create an account or sign in to comment
You need to be a member in order to leave a comment
Create an account
Sign up for a new account in our community. It's easy!
Register a new accountSign in
Already have an account? Sign in here.
Sign In Now