Here and there: corporate profits in the US and Australia

Entry posted by MongiIG in Market News
352 views
We take a look at the big corporate updates on the ASX and Wall Street
Equity markets domestically and in the US have seen a fresh batch of corporate earnings and trading updates.
In this week’s investor spotlight, we take a look at the latest news out of corporate Australia and America.
US earnings season update
On balance, Q3 earnings for S&P 500 companies were soft, if not underwhelming. Earnings growth for the quarter was 2.2% - below the consensus estimate leading into the period of 2.6% and the lowest number since the pandemic recession. The number of earnings beats was also below the long-run average.
69% of companies managed to exceed expectations. However, that was under the average of 71%. Revenues were slightly above for the quarter.
But a squeeze on margins from higher costs was a large part of the EPS miss for the market. Of greatest import for investors, forecasts for Q4 earnings were progressively downgraded throughout the earnings period.
Consensus estimates now point to a contraction of 2.1% for the quarter.
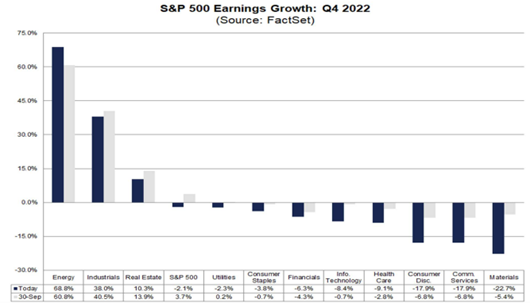 Source: FactSet
Retail stocks deliver mixed results
Notionally, last week was the last for corporate earnings. 95% of companies have now reported, with some of the US retail heavyweights delivering their quarterly results.
The numbers proved to be very mixed. Walmart managed to exceed expectations, delivering EPS of $1.50 against the $1.32 estimate, driven by a solid revenue beat. The company lifted its full-year guidance off the back of the result but flagged challenges to the outlook as cost of living pressures increase.
Target proved a significant disappointment, however. It posted EPS of $1.54, undershooting the $2.13 forecast, as profits fell by more than 50% from a year earlier. It also flagged building headwinds to future profits, due to the “rapidly evolving consumer environment”.
Target’s shares dropped by as much as 15% on the day of the results and finished the week more than 5% lower.
Target stock is in a downtrend, with investors remaining sellers of the stock above $170 per share. Two higher lows have been forged by price action, however, with an upward-sloping support line emerging. A break below that level could herald greater selling, while a close above $170 might suggest buyers are back to controlling price.
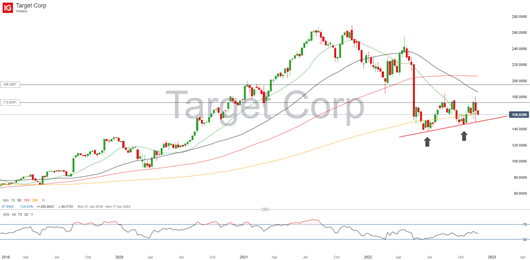 Source: IG
US Retail Sale remains robust
Data released last week showed US retail sales remain robust. Nominal sales increased 1.3% in October, exceeding the 1% forecast. A part of the reason for the increase was inflationary in nature: the nominal value of sales increases due to higher prices.
However, its clear consumption remains strong in the US and above the long-term trend, stoking questions about whether this activity can continue, will begin to peter off, or crash back to earth.
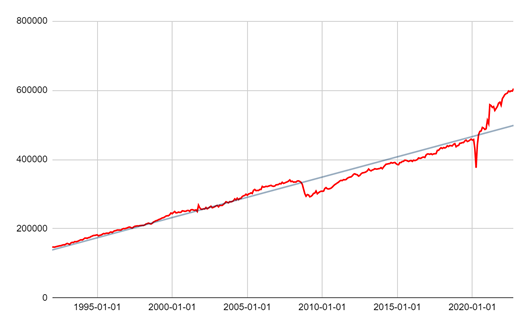 Source: IG
A look back on the banks
The Australian banks have delivered several earnings results and updates in recent weeks. The ANZ posted full-year earnings at the end of October, revealing a 16% jump in statutory profit and a 3% increase in dividends. The NAB posted full-year results at the start of November, revealing a profit jump of 8.3% and a significant increase in its full-year dividend of 18.9%.
Both results were underpinned by solid lending growth and widening margins as interest rates rose.
CBA delivered a trading update last week, revealing $2.5 billion cash profit for its first quarter, an increase of 2%. Troublesome and impaired assets also decreased, while the bank hasn’t flagged any increased provisions for bad debts going forward. Rising interest rates were cited as a tailwind for the bank, although the CBA did not provide numbers on net interest margins.
CEO Matt Comyn reaffirmed his confidence in the medium to long-term outlook for the business and Australian economy, despite inflationary pressures.
CBA’s share price has risen significantly recently, with the stock approaching record highs. The trend is ultimately sideways, with the price reaching technical resistance around $107 to $108 per share.
A break above that level would open a run to fresh all-time highs. Support might be found around technical support and the 20 and 50-week moving averages around $100.
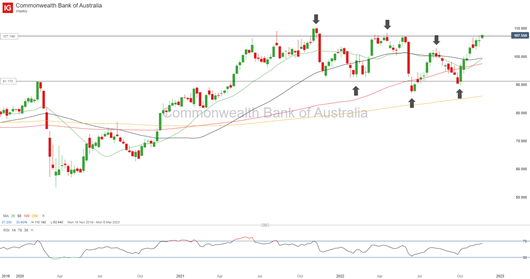 Source: IG


.jpeg.98f0cfe51803b4af23bc6b06b29ba6ff.jpeg)

0 Comments
Recommended Comments
There are no comments to display.
Create an account or sign in to comment
You need to be a member in order to leave a comment
Create an account
Sign up for a new account in our community. It's easy!
Register a new accountSign in
Already have an account? Sign in here.
Sign In Now