Attempts for Santa rally short-lived thus far: Nasdaq 100, ASX 200, Gold

Entry posted by MongiIG in Market News
1,140 views
Amid the low-volume environment, US equity indices failed to find its way higher overnight as attempts for a Santa rally have been short-lived thus far.
 Source: Bloomberg
Market Recap
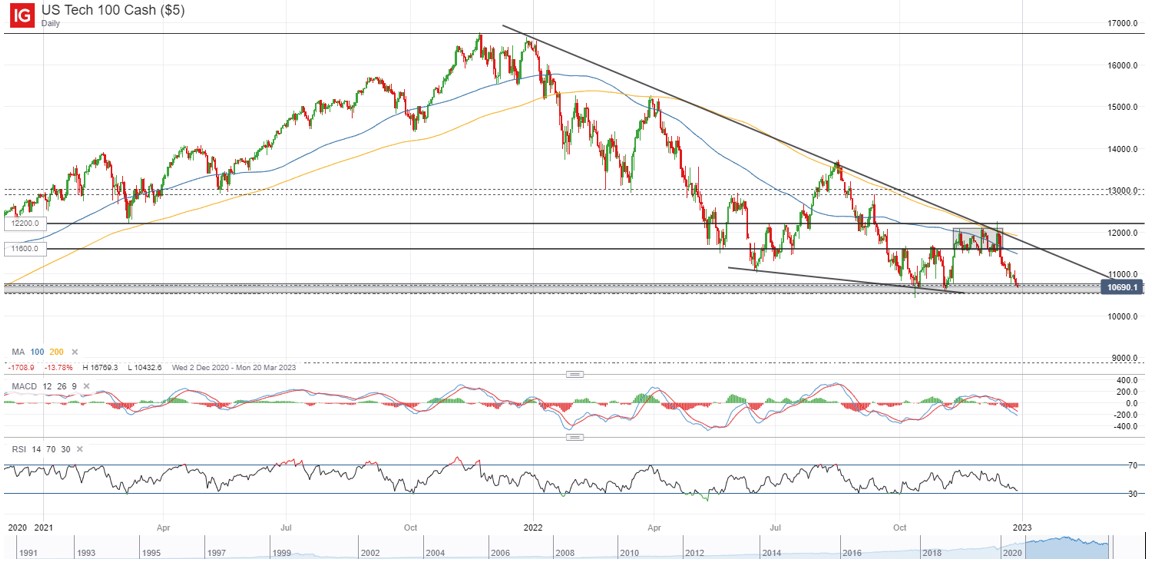
Amid the low-volume environment, US equity indices failed to find its way higher overnight as attempts for a Santa rally have been short-lived thus far. All 11 S&P 500 sectors are in the red, with the rate-sensitive growth sectors reacting to higher Treasury yields with greater downside moves while the energy sector weighed more than 2% lower on weaker oil prices. Recent downside has brought the Nasdaq 100 index to retest its 2022 lows once more at the 10,600 – 10,700 range, as failure for dip buyers to hold the line may leave the key psychological 10,000 level on watch next. A continuous retest of a key support may drain the supply of buyers at the level and increases the chances of a downward break.
 Source: IG charts
The holiday-shortened week remains light on economic data, with lower-than-expected US pending home sales and Dallas Federal Reserve (Fed) December manufacturing index supporting weaker economic conditions but nevertheless failed to prompt much of a reaction in the indices. The day ahead will leave the weekly jobless claims on the calendar, which is expected to tick slightly higher from the previous month. The lack of a clear catalyst for the equity bulls seems to be at play, with downside momentum set in the aftermath of the December Fed meeting guiding for a drift lower amid the quieter festive period.
Asia Open
Asian stocks look set for a negative open, with Nikkei -1.11%, ASX -1.02% and KOSPI -0.82% at the time of writing, largely following through with the more than 1% fall in its US counterparts overnight. Apart from some resilience in the US dollar serving as headwinds for risk sentiments, market participants are also having their eyes on the reopening of China, which prompted other countries to enact new travel rules for Chinese visitors. Nevertheless, while this could drive near-term volatility in leading to knock-on virus surges across the globe, China’s reopening could still mark a positive step over the long run in light of past global attempts in bringing virus cases under control. Higher risks may come in the form of new variants’ resistance to current vaccines, but that has not been presented for now. The Hang Seng Index has overcome its 200-day moving average (MA), as a sign of a longer-term shift in trend to the upside.
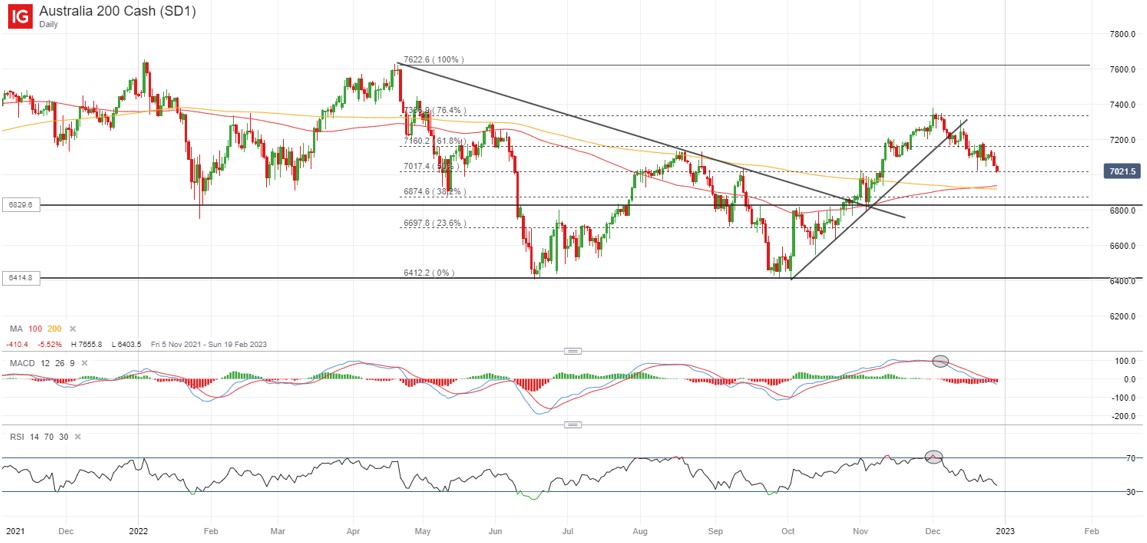
On the other hand, the ASX 200 is heading to retest its key 7,000 level, where previous dip-buying efforts were seen in coincidence with a 50% Fibonacci retracement. Some resilience in the US dollar, a more muted risk environment and China’s ongoing struggle with Covid-19 cases has kept sellers in control for now, with any break below the 7,000 level potentially paving the way towards the 6,930 level next where a confluence of MAs stands in place.
 Source: IG charts
On the watchlist: Gold prices trending along rising wedge pattern
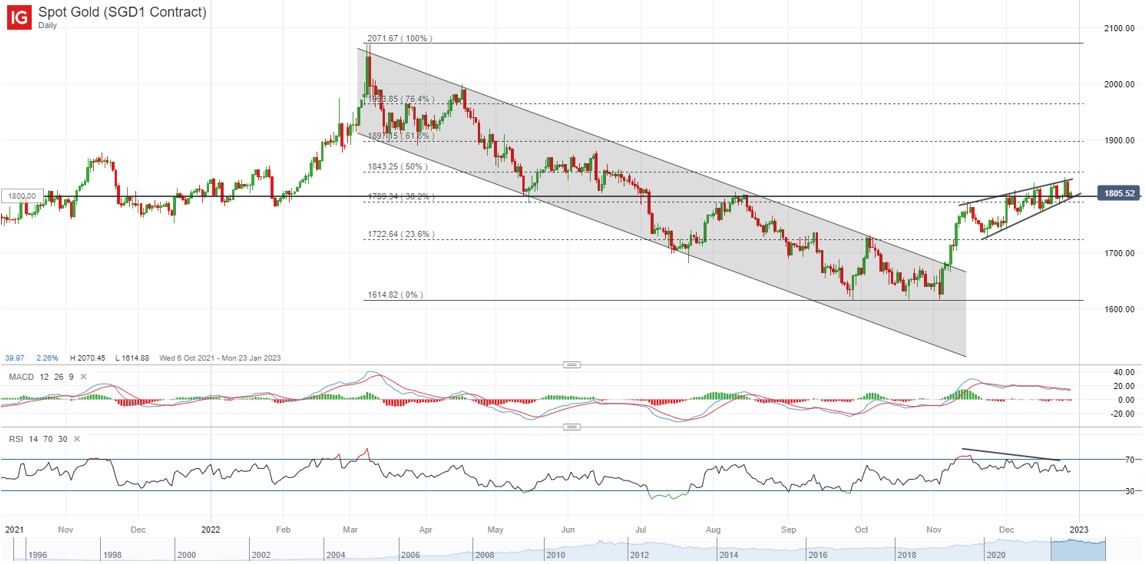
Attempts for the US dollar index to stabilise over the past weeks, along with a move higher in US Treasury yields, have restricted gold prices’ upside for now as the relative strength index (RSI) presented dwindling upside momentum on lower highs. That said, prices are attempting to hold onto the key US$1,800 level, with its movement guided by a rising wedge pattern amid the low-volume, little-catalyst environment. Any break of the wedge pattern will be on watch into next week, and failure for the US$1,800 to hold may prompt a move lower towards the US$1,770 level next, where its 200-day MA stands.
 Source: IG charts
Wednesday: DJIA -1.10%; S&P 500 -1.20%; Nasdaq -1.35%, DAX -0.50%, FTSE +0.32%


.jpeg.98f0cfe51803b4af23bc6b06b29ba6ff.jpeg)

0 Comments
Recommended Comments
There are no comments to display.
Create an account or sign in to comment
You need to be a member in order to leave a comment
Create an account
Sign up for a new account in our community. It's easy!
Register a new accountSign in
Already have an account? Sign in here.
Sign In Now