AMD’s share price and Q4 earnings results preview

Entry posted by MongiIG in Market News
460 views
Find out what to expect from AMD’s earnings results, how they will affect AMD share price, and how to trade AMD’s shares.
 Source: Bloomberg
When are AMD’s results expected?
AMD is expected to release its Q4 earnings on Tuesday, January 31st.
AMD share price: forecasts from Q4 results
And those long AMD’s shares will be hoping that even if it misses both earnings and estimates as it did in its third quarter release, it can still enjoy a rise in prices, though the blow was cushioned by preliminary third-quarter results weeks prior that had already warned of lagged guidance. There was optimism about cloud revenue and server chips, but there’s no taking away what’s been happening on the PC side of the business.
In turn, expect focus to be on how the PC market demand is faring after weakness there “and significant inventory corrections across the PC supply chain” were cited as reasons it couldn’t match earlier guidance, even if dull fourth quarter demand for computers is something its CEO says they’ve already been prepping for, especially if a part of its offering is seen as more discretionary (gaming) than necessary within that sphere, and at a time when demand from cryptocurrency miners is expected to remain sedate.
Semiconductor prices (PHLX Semiconductor Index) finished the quarter a bit higher after brief lows in October and higher highs in November and early to mid-December.
Their new line of data centre ‘Genoa’ chips was launched in November, and the release of its high-end graphics cards late last quarter, this at a time when high-end cards are unlikely to sell as fast in the current inflationary climate, with expectations late this year or early next year will fare better. Rival Intel released its own line of the latter, so it’s also a matter of how AMD has managed to keep up against both it and Nvidia. The extent to which Intel has been able to respond will be noted when it releases its figures this Thursday.
In all, expectations are we’ll see earnings per share (EPS) reading of $0.67 matching the final figure for the third quarter, and revenue a tad lower quarter-on-quarter but still within the $5.5 billlion handle (source: Refinitiv). As for analyst recommendations, while there’s quite a number on hold (10), it’s a clear majority when looking at combined buy (18) and strong buy (12) recommendations and in all more optimistic than semiconductors overall where it’s also net majority buy.
The average price target amongst them stands at $91.01, far higher than where its share price currently resides (source: Refinitiv). Both AMD and (more so) rival Nvidia continue to trade at forward price-to-earnings ratios (P/E) above the industry average.
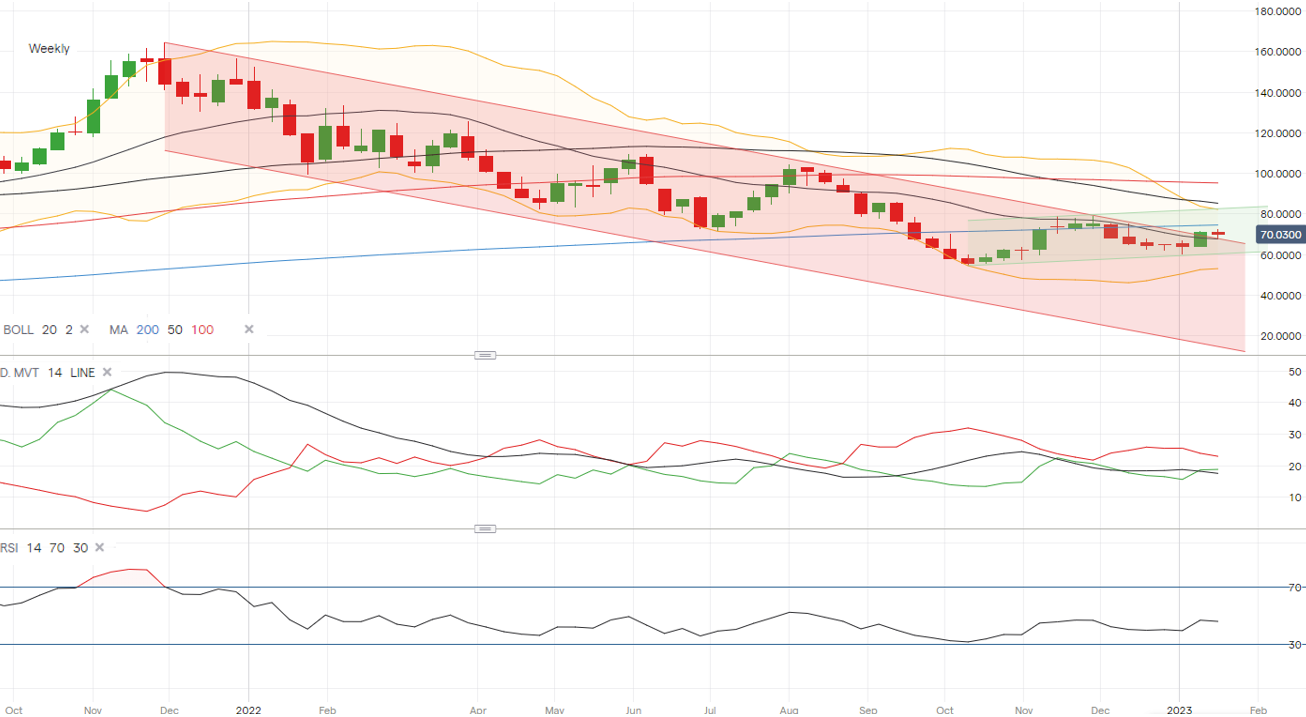
AMD weekly chart with key technical indicators
 Source: IG
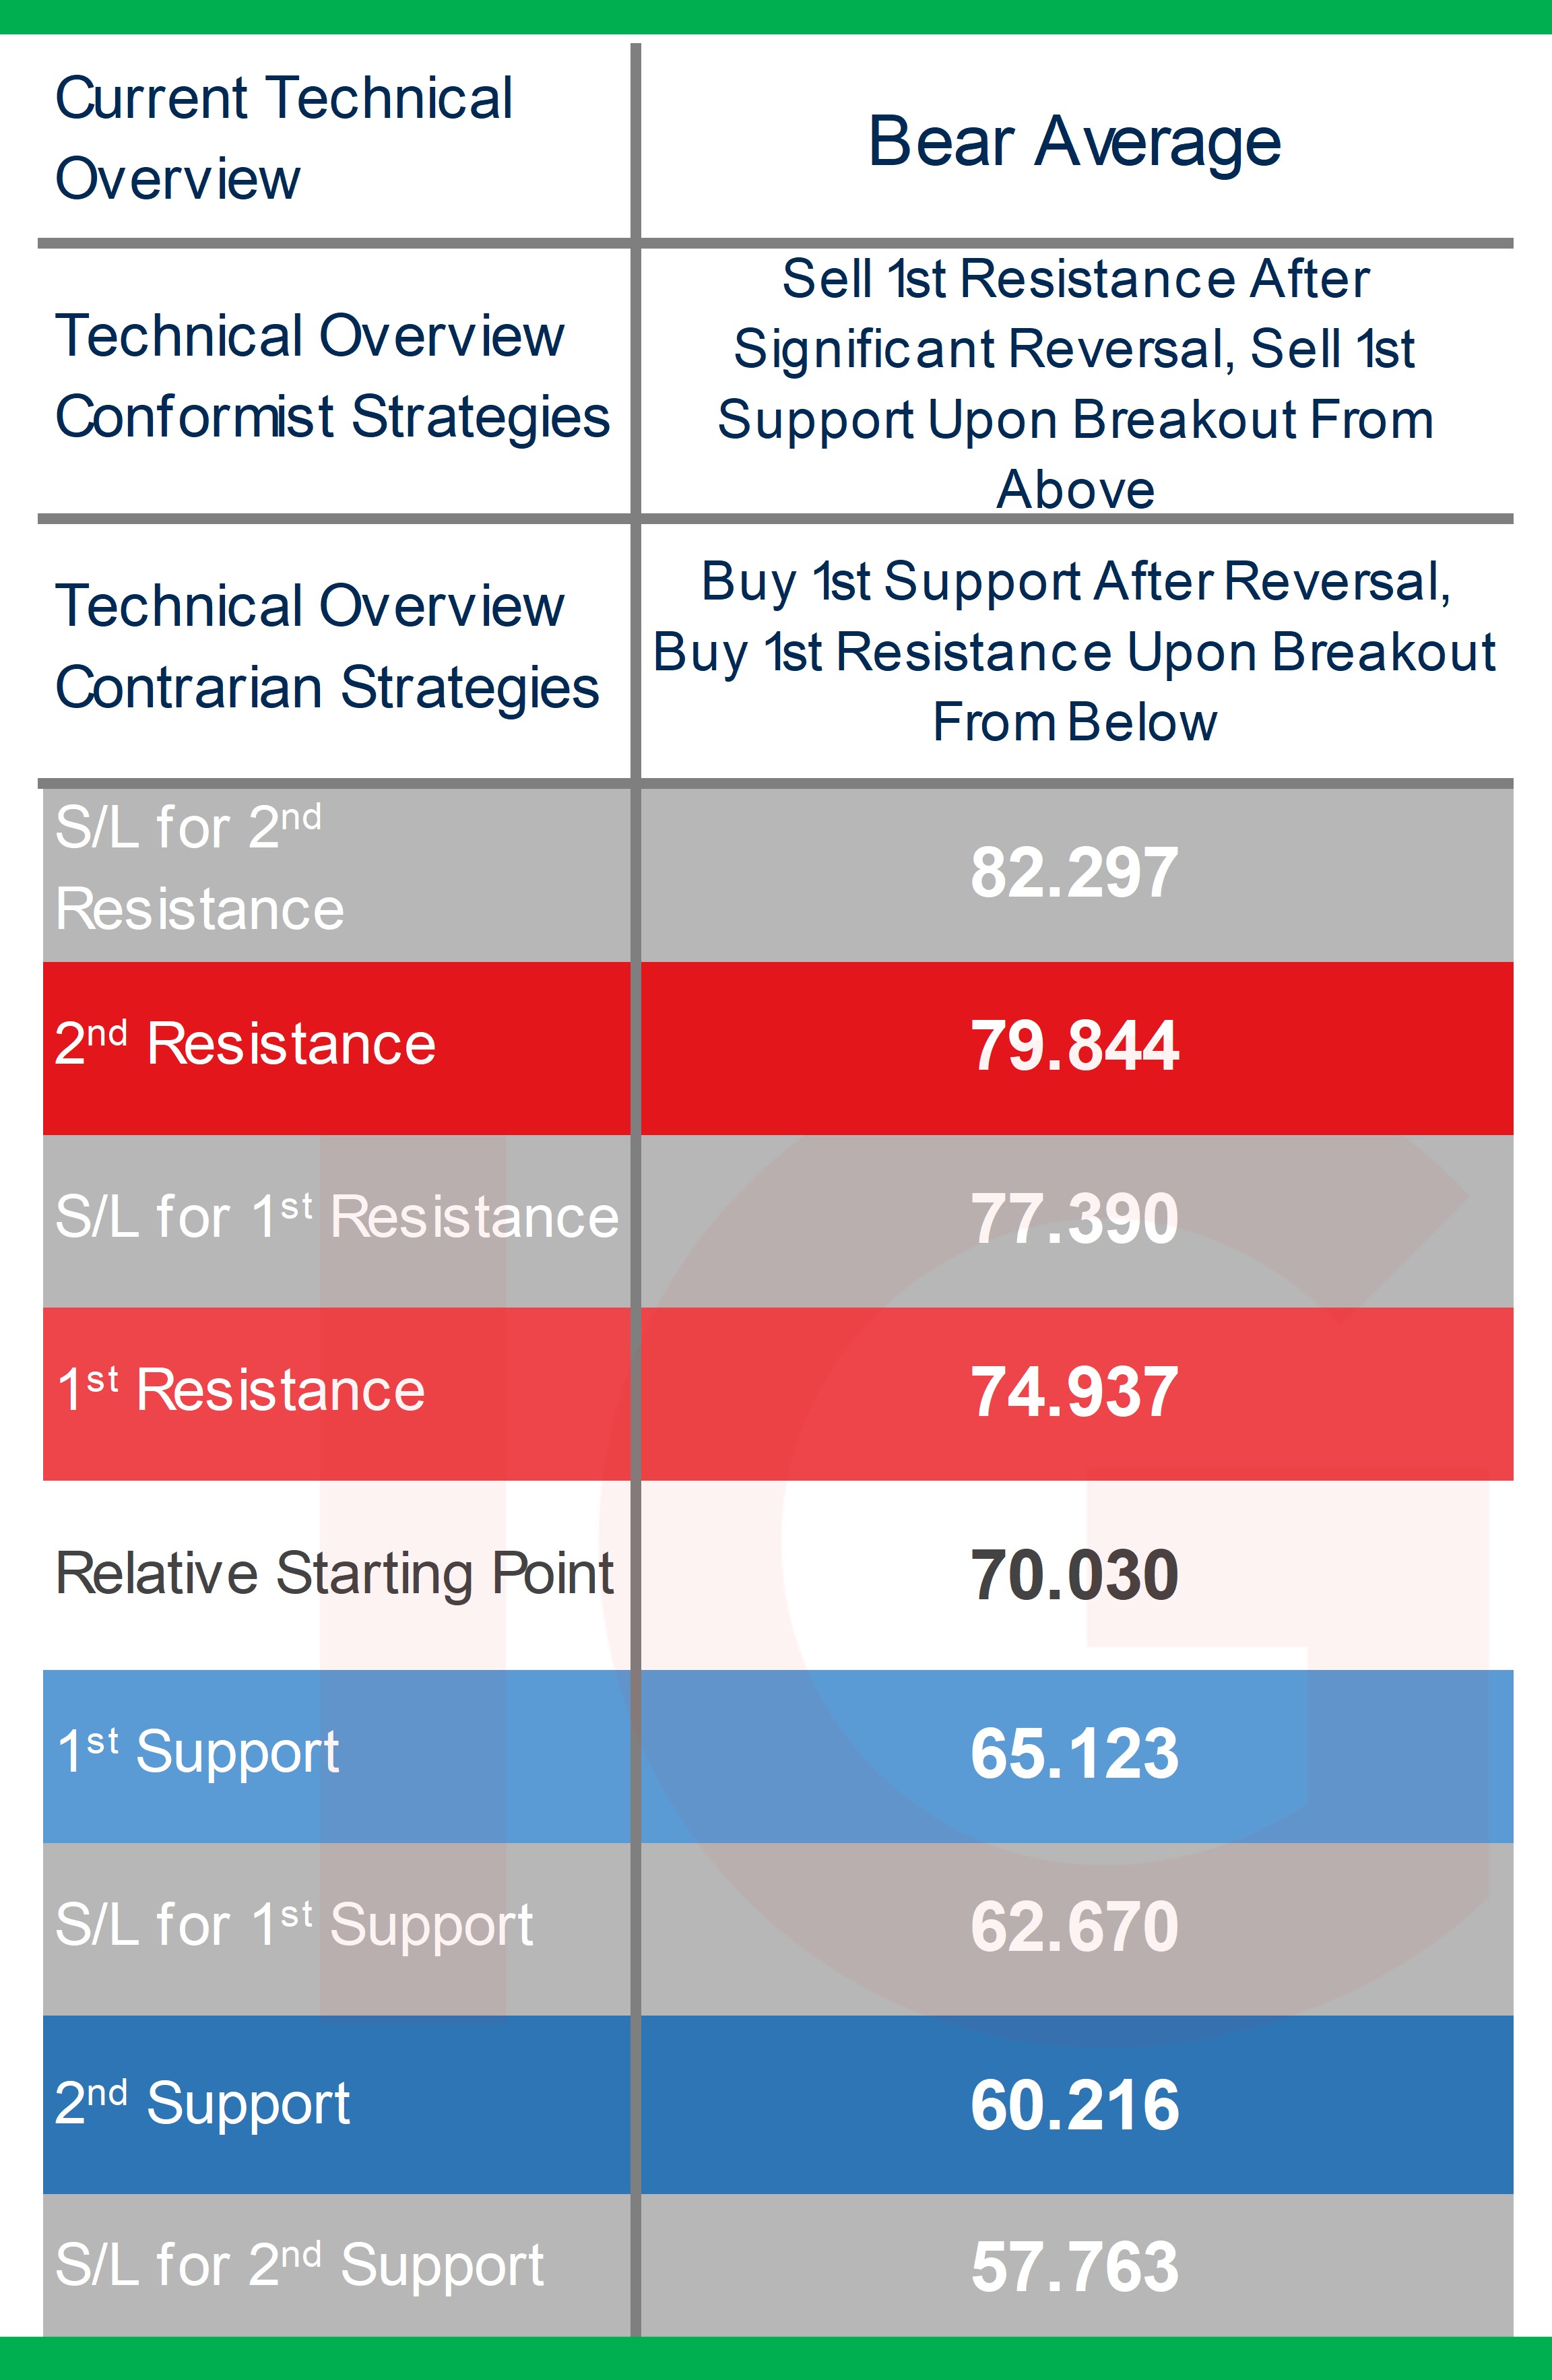
Trading AMD’s Q4 results: technical overview and trading strategies
From a technical standpoint, prices have moved above their weekly short-term moving averages (MA), but have yet to cross their long-term MA’s with the 200-week not that far off. It recently pulled out of its longer-term bear trend channel (red shaded in the image above) the start of which was off its highs in November of 2021 as the tech sector suffered heavily in 2022, and the lift-off of last October’s lows (after its preliminary third-quarter earnings release hit the wires) consolidatory with slight positive technical bias.
The daily time frame is showing a bit more positive technical bias though we’ve had a strong movement for the tech sector outperforming in general for over a week now. Prices are near the upper end of its daily Bollinger Band, and when it comes to its DMI (Directional Movement Index) showing a small positive margin between +DI and -DI.
Zooming out to the weekly time frame however, it still has quite a bit of climbing to do to tilt a few key technical indicators, with a -DI still above its +DI thus far, and an ADX (Average Directional Index) reading no longer in trending territory.
Summing up the overview on the longer-term weekly time frame and it’s a weak bear average where prices have managed to recover at times and oscillations weakening some indicators, but we're getting out of its bear channel meaning it’ll need less to shift to a more consolidatory overview provided the intraweek moves remain relatively contained.
What it also means from a strategic standpoint is that conformist strategies are sell and contrarians buy, but with far more caution for the former when it comes to selling off its weekly 1st Resistance level, doing so only after a significant reversal if it comes to pass.
Those expecting upside bias and further risk-on or especially ‘buy-everything’ moves can entertain contrarian buy-breakouts off the weekly 1st Resistance level or buy-after-reversals after its 1st Support, and more so for those expecting the worst with regards to its bear overview has passed.
A reminder that when it comes to fundamental events – chief amongst them earnings – that technicals will hold less relevance and levels are far less likely to hold once the figures are released, last time around its share prices rose as much as 6% when third quarter numbers hit the wires at the beginning of October.
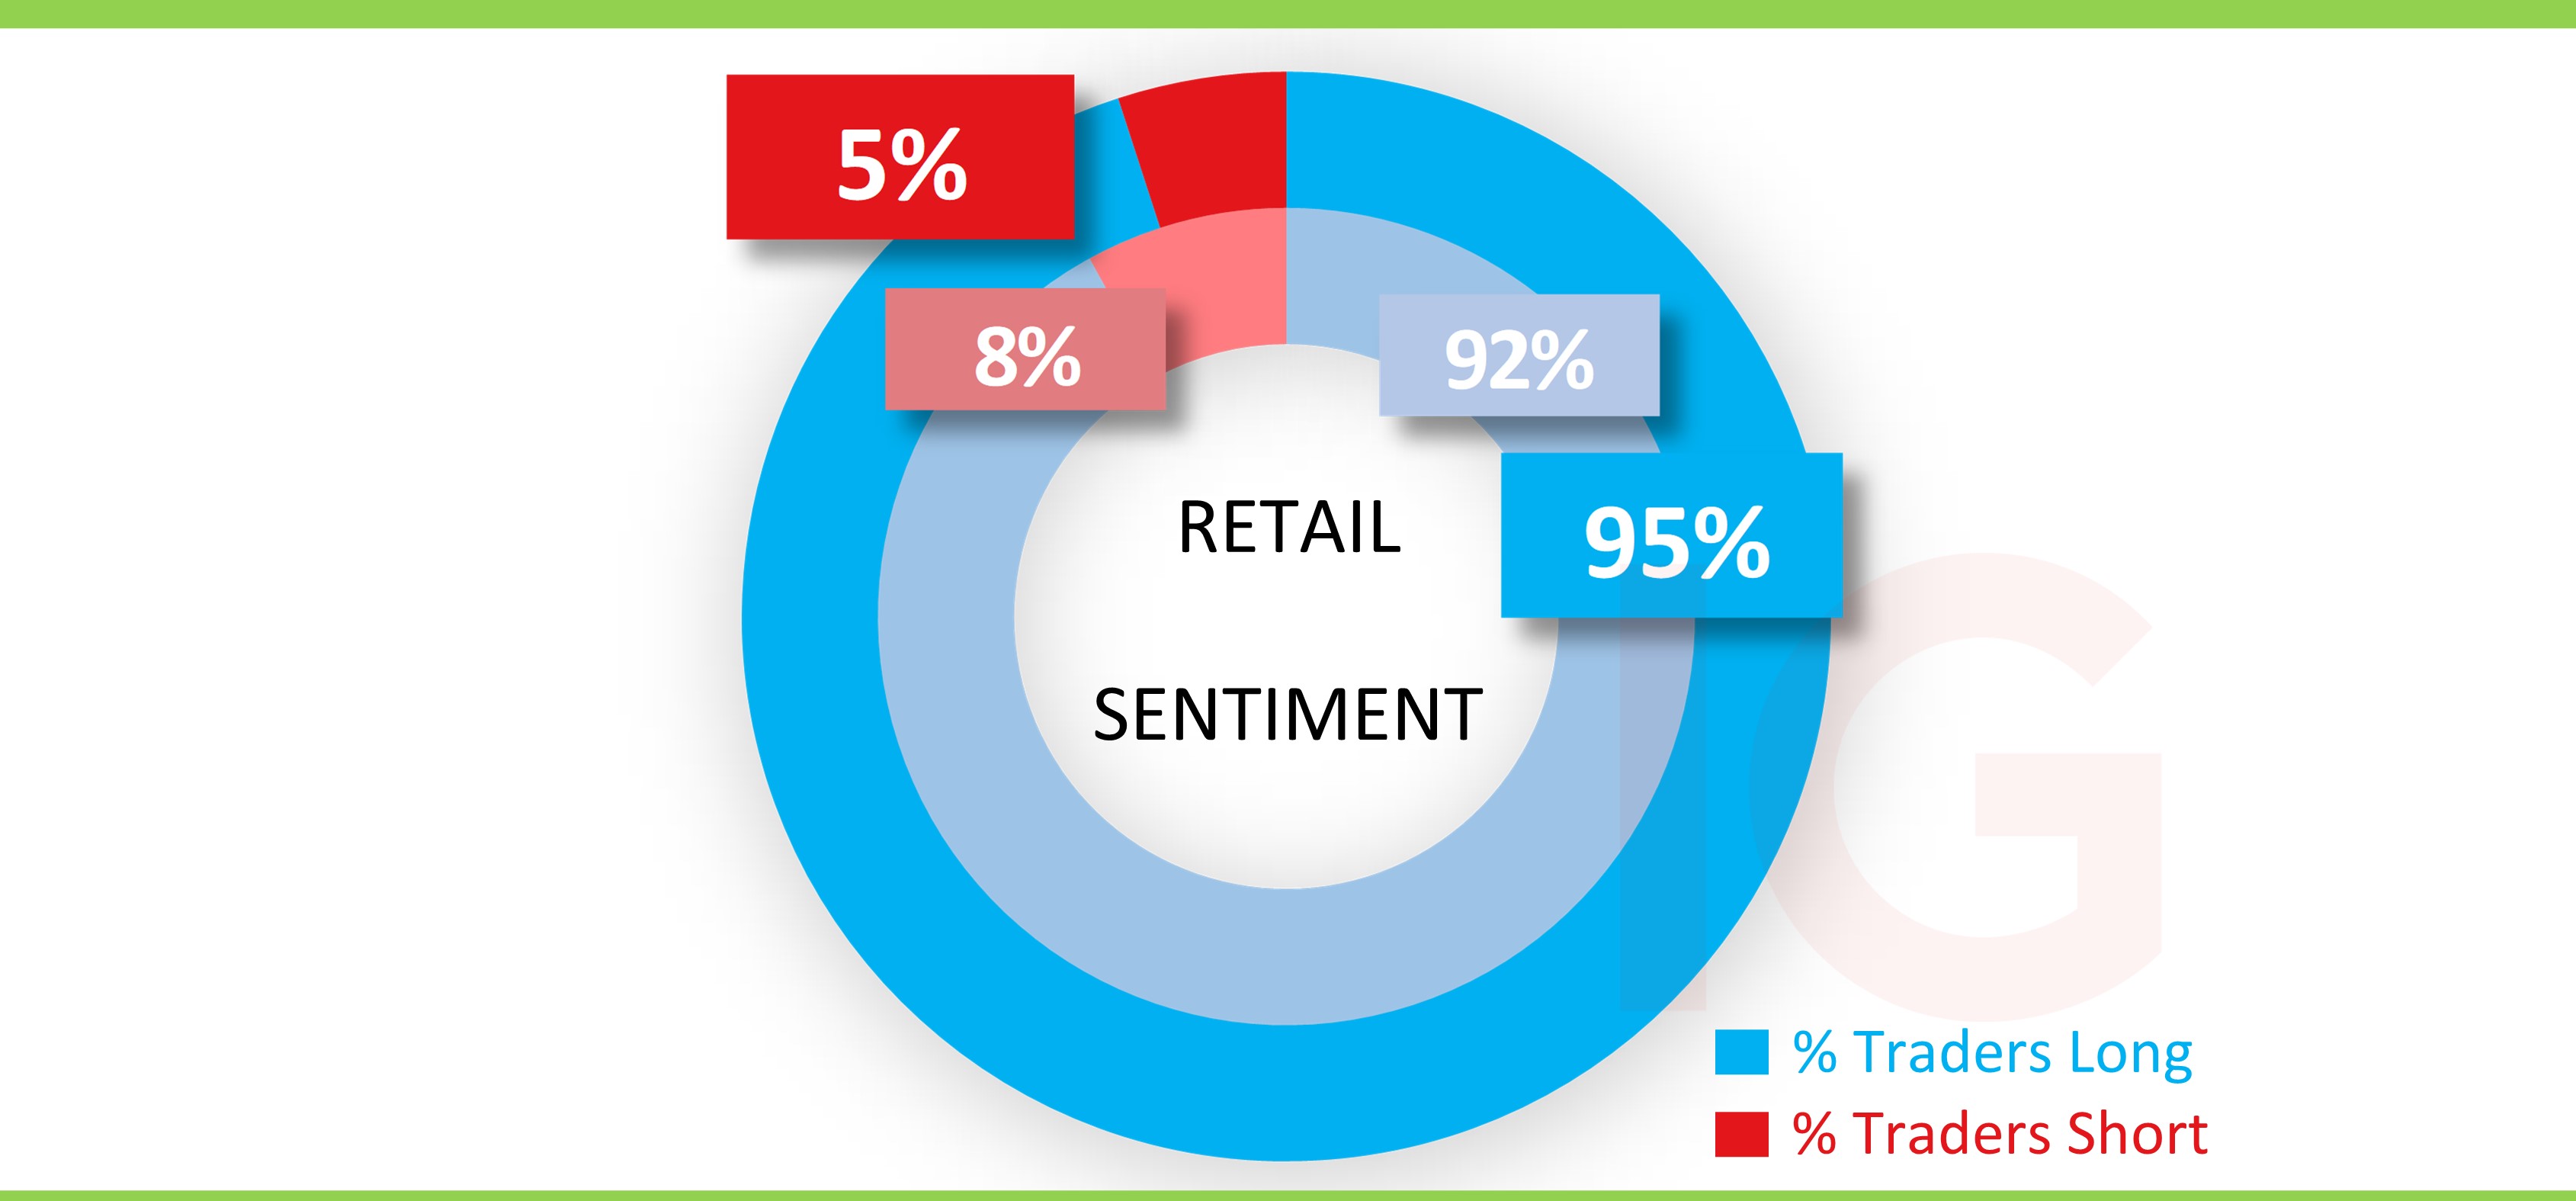
IG Client sentiment* and short interest for AMD shares
In what is usually the case with most single stocks, the bias was and remains extreme amongst for retail traders, at 92% near the beginning of this month and since then rising further to 95% as of the start of this week.
As for short interest, it’s been hovering largely within the 30m-40m range since March of last year, with the latest reading 32.3m shares that represent 2% of shares, a slightly higher percentage than most of its larger rivals (source: Refinitiv).
 Source: IG
*The percentage of IG client accounts with positions in this market that are currently long or short. Calculated to the nearest 1%, as of today morning 9am for the outer circle. Inner circle is from the 5th of January 2023.


.jpeg.98f0cfe51803b4af23bc6b06b29ba6ff.jpeg)

0 Comments
Recommended Comments
There are no comments to display.
Create an account or sign in to comment
You need to be a member in order to leave a comment
Create an account
Sign up for a new account in our community. It's easy!
Register a new accountSign in
Already have an account? Sign in here.
Sign In Now