Wall Street delivered worst day of 2023 overnight: S&P 500, NZD/USD, Gold

Entry posted by MongiIG in Market News
480 views
The US equity markets started the new trading week with its worst one-day performance in 2023, as Treasury yields resumed its way higher.
 Source: Bloomberg
Market Recap
The US equity markets started the new trading week with its worst one-day performance in 2023, as Treasury yields resumed its way higher and drove rate-sensitive tech firms to unwind almost all of its month-to-date gains. The US two-year yields are back to retest its November 2022 peak, while the 10-year yields jumped to a new three-month high, both reacted strongly to the higher-than-expected read in the US flash Purchasing Managers' Index (PMI) figures. Warnings from major retailers that higher prices are impacting consumer behaviour did not go well with the risk environment too.
The recent stream of economic data has been pointing towards resilience in US economic conditions and while the narrative has been one of ‘no landing’ as opposed to the previous ‘hard landing’, interest rate expectations are also seeing a hawkish recalibration as a result. This recalibration seems to be the catalyst for jitters, although one may argue that we are in a better position now. While yields have reverted to their multi-month highs, the equity markets are not at their multi-month lows. Staying above their respective 200-day moving average (MA) continues to keep hopes for the continuation of the rally alive. The S&P 500 remains one to watch, currently retesting its key psychological 4,000 level. Several support lines will have to be breached to present a new bearish trend, including several key trendline support and its 200-day MA.
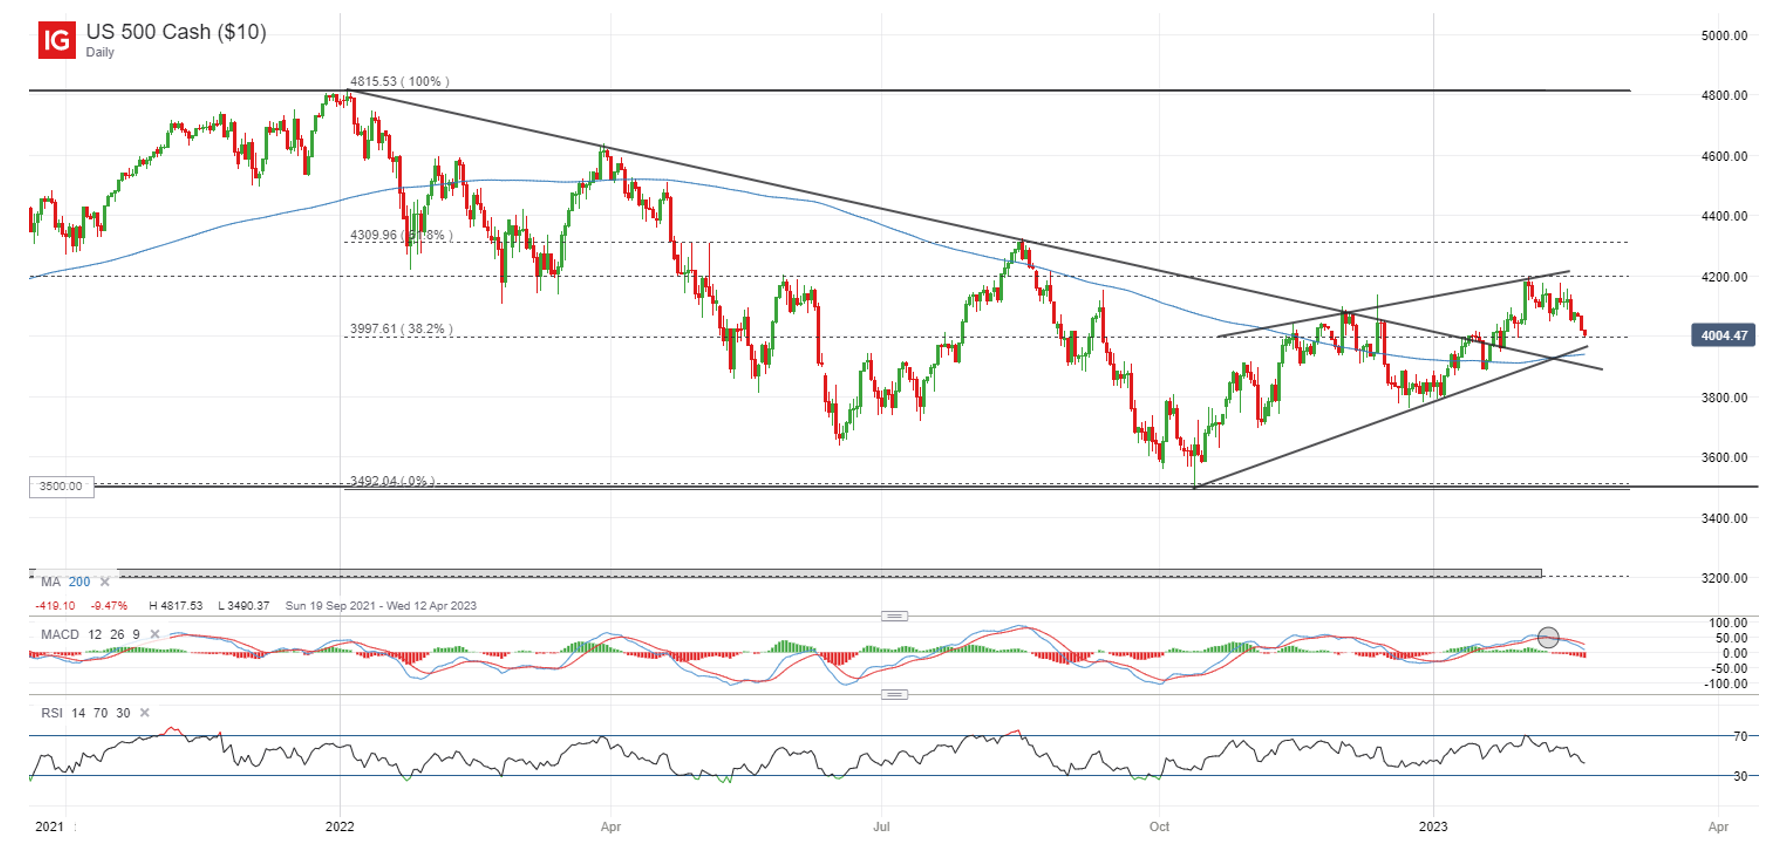 Source: IG charts
Asia Open
Asian stocks look set for a negative open, with Nikkei -1.06%, ASX -0.52% and KOSPI -1.23% at the time of writing, with the heavy sell-off in Wall Street providing a negative backdrop for risk sentiments in the region as well. More growth-exposed Nikkei and KOSPI came under greater selling pressure, as rate-sensitive counters saw some unwinding to position for higher bond yields. The AUD/USD saw a knee-jerk move lower this morning, in reaction to lower-than-expected wage growth (3.3% versus 3.5% forecast) but whether it will prompt the Reserve Bank of Australia (RBA) to ease up on their tightening process still remains to be seen.
Heading into the upcoming RBNZ meeting, a 50 basis-point (bp) hike remains the strong consensus (96% probability), but market pricing is also for a downshift to 25 bp hike thereafter. Declining economic activities and inflation being not as bad as feared since the last meeting have suggested cash rate increases to be less aggressive than before. Any dovish confirmation from the central bank and subsequent softer data could lead the NZD lower. For the NZD/USD, it continues to hover at the neckline of a near-term double-top pattern. Lower peaks in Moving Average Convergence/Divergence (MACD) seems to suggest moderating upward momentum, with any break below the 0.622 level potentially paving the way towards the 0.593 level next.
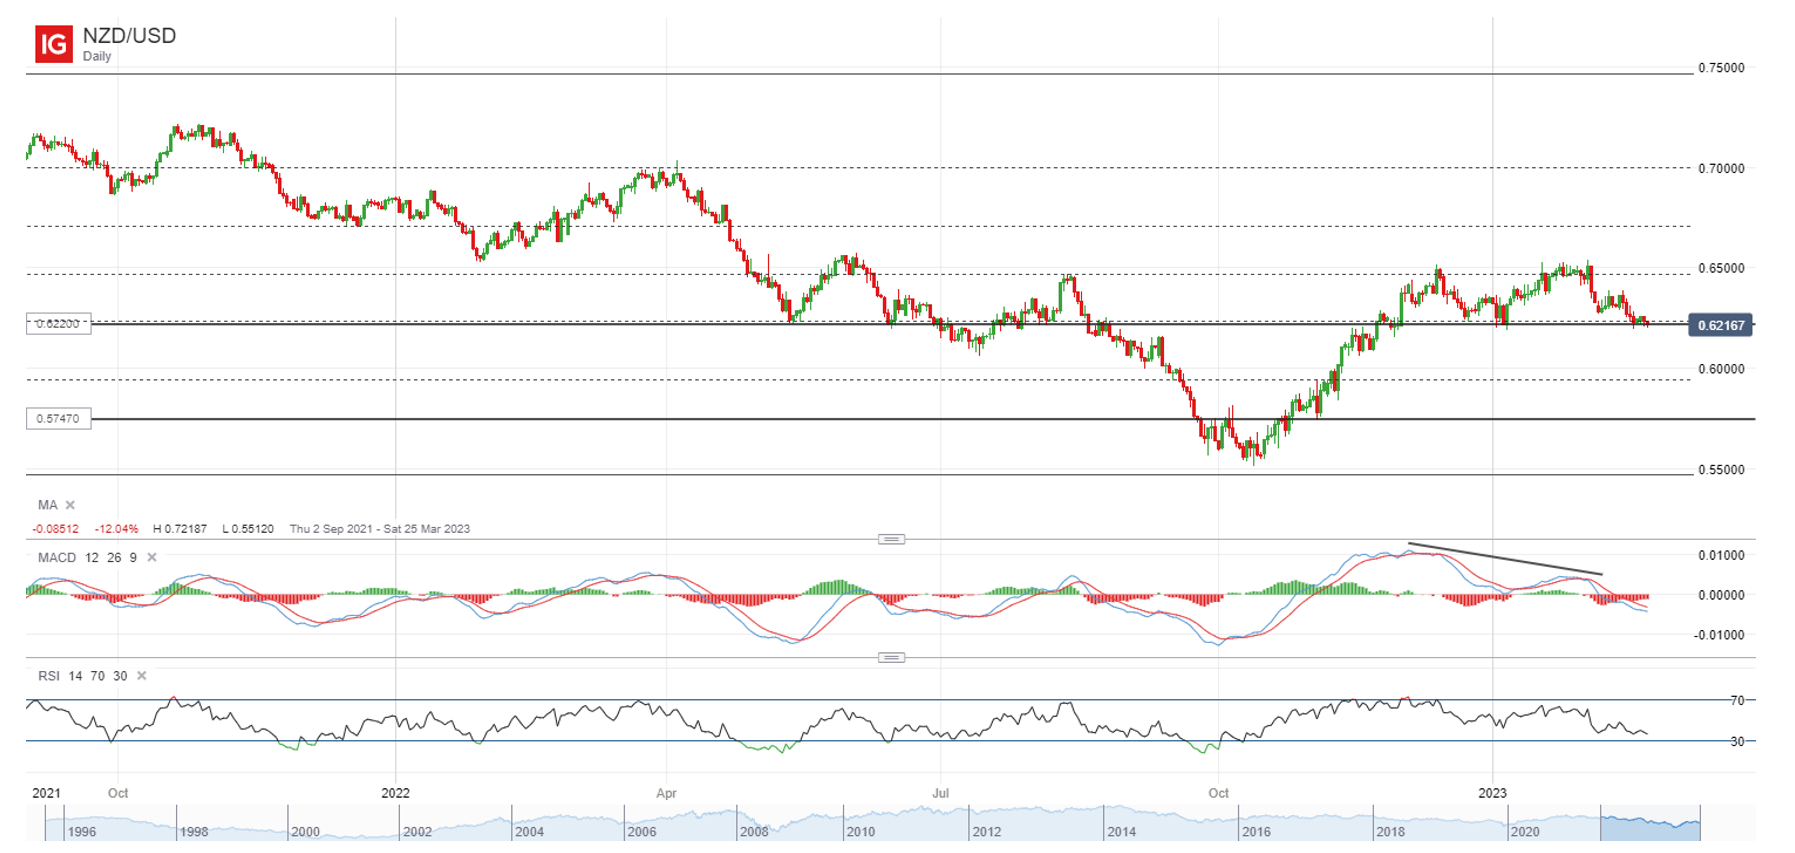 Source: IG charts
On the watchlist: Gold prices continue to hover below key resistance
The sell-off in gold prices has been stalling in recent days, taking its cue from US Dollar moves which saw more measured gains despite a surge in Treasury yields. This comes as market participants continue to struggle with recalibrating their rate expectations to lean towards a higher peak rate, as recent economic data seem to pose a challenge to the Federal Reserve’s (Fed) ‘disinflation process’. That said, gold prices may have to move beyond the US$1,842 level of resistance, where a 50% Fibonacci retracement level stands, to provide greater conviction of renewed traction in place. Failure to cross the US$1,842 level could mark the formation of another lower high and reinforce the near-term downward bias to the US$1,800 level next.
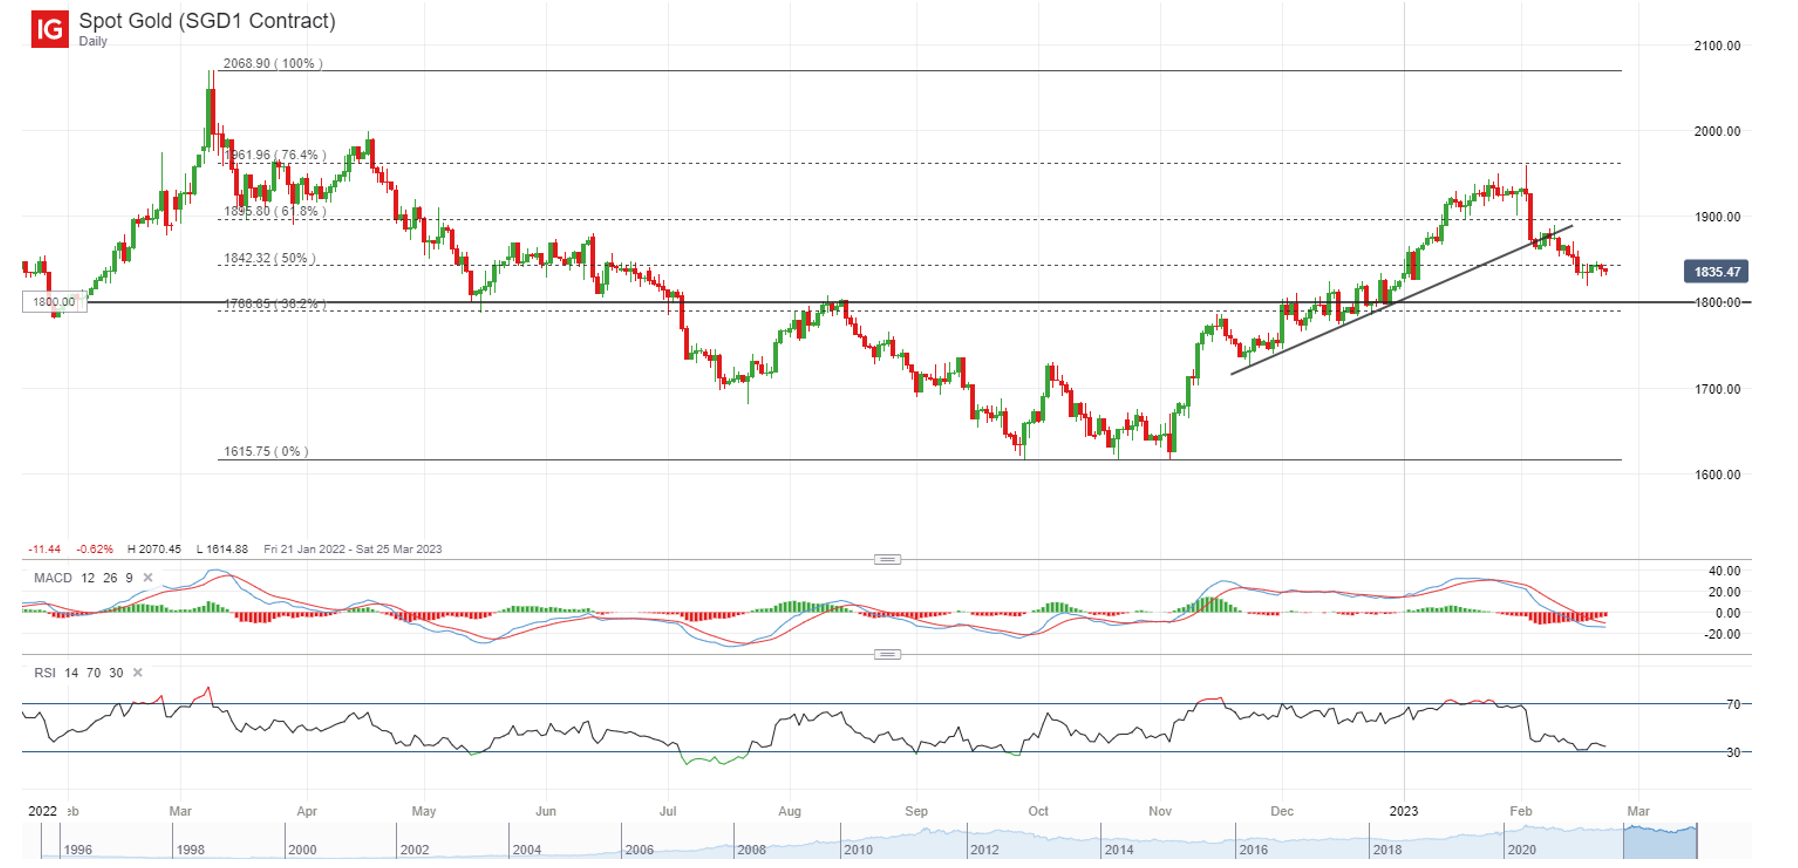 Source: IG charts
Tuesday: DJIA -2.06%; S&P 500 -2.00%; Nasdaq -2.50%, DAX -0.52%, FTSE -0.46%


0 Comments
Recommended Comments
There are no comments to display.
Create an account or sign in to comment
You need to be a member in order to leave a comment
Create an account
Sign up for a new account in our community. It's easy!
Register a new accountSign in
Already have an account? Sign in here.
Sign In Now