FTSE 100: Rolls Royce share price and FY earnings results preview

Entry posted by MongiIG in Market News
749 views
Outlook on the Rolls Royce share price ahead of its upcoming FY results.
 Source: Bloomberg
When are Rolls Royce Banking Group’s results expected?
Rolls Royce is set to release its full year (FY) 2022 results on 23 February 2023. The results are for the full year ending December 2022.
What is ‘The Street’s’ expectation for the FY results?
‘The Street’ expectations for the upcoming results are as follows:
Revenue of £11.66 billion : +3.97% year-on-year (YoY)
Earnings per share (EPS) at 0.62 pence : +564% (YoY)
Rolls Royce fundamental outlook
Rolls Royce is flying high with its shares trading up by nearly 14% year-to-date amid China’s re-opening and the country’s civil aviation surging by close to 35% in January when compared to a year ago despite Covid-19 rates hitting all-time highs, even if boosted by the Chinese New Year festival.
Increasing number of flights domestically and internationally in China are important for Rolls Royce’s civil aerospace business, which generates around 40% of underlying revenue, as the engineering company earns money not just from the sale of its engines but also from engine performance hours.
Last week’s announcement that Air India plans to buy a massive 470 aircraft, including 40 Airbus A350 planes, which will have a Rolls-Royce-powered engine, also points to a recovery in the aerospace business from which Rolls Royce should greatly benefit.
These recent developments won’t be showing in Rolls Royce’s full year results ending in December 2022, though, but the board-based power and propulsion provider is expected to show a strong performance in its defence and power business segments due to the nearly year-long war in Ukraine.
Better-than-expected full year results may be seen despite Rolls Royce’s - as of 1 January - new CEO Tufan Erginbilgic’s comments likening the company to a “burning platform” and that a major reshuffle was due as its performance had become “unsustainable.”
Shareholders will also want to see in Rolls Royce’s forward guidance how the company plans to reduce its £4bn mountain of debt which will weigh on its future profitability.
How to trade Rolls Royce into the results
 Source: Refinitiv
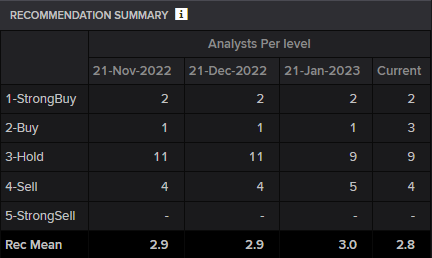
Refinitiv data shows a consensus analyst rating of ‘hold’ for Rolls Royce – 2 strong buy, 3 buy, 9 hold and 4 sell - with the median of estimates suggesting a long-term price target of 110.00 pence for the share, roughly 2% lower than the current price (as of 21 February 2023).
 Source: IG
IG sentiment data shows that 94% of clients with open positions on the share (as of 21 February 2023) expect the price to rise over the near term, while 6% of clients expect the price to fall whereas trading activity over this week showed 68% of buys and this month 66% of sells.
Rolls Royce – technical view
Rolls Royce’ share price has only managed to break through its 2018-to-2023 downtrend line in mid-January, as it benefitted from China’s re-opening and increased demand for its products, but since hasn’t made any substantial headway despite trading up by around 13% year-to-date.
Rolls Royce Weekly Chart
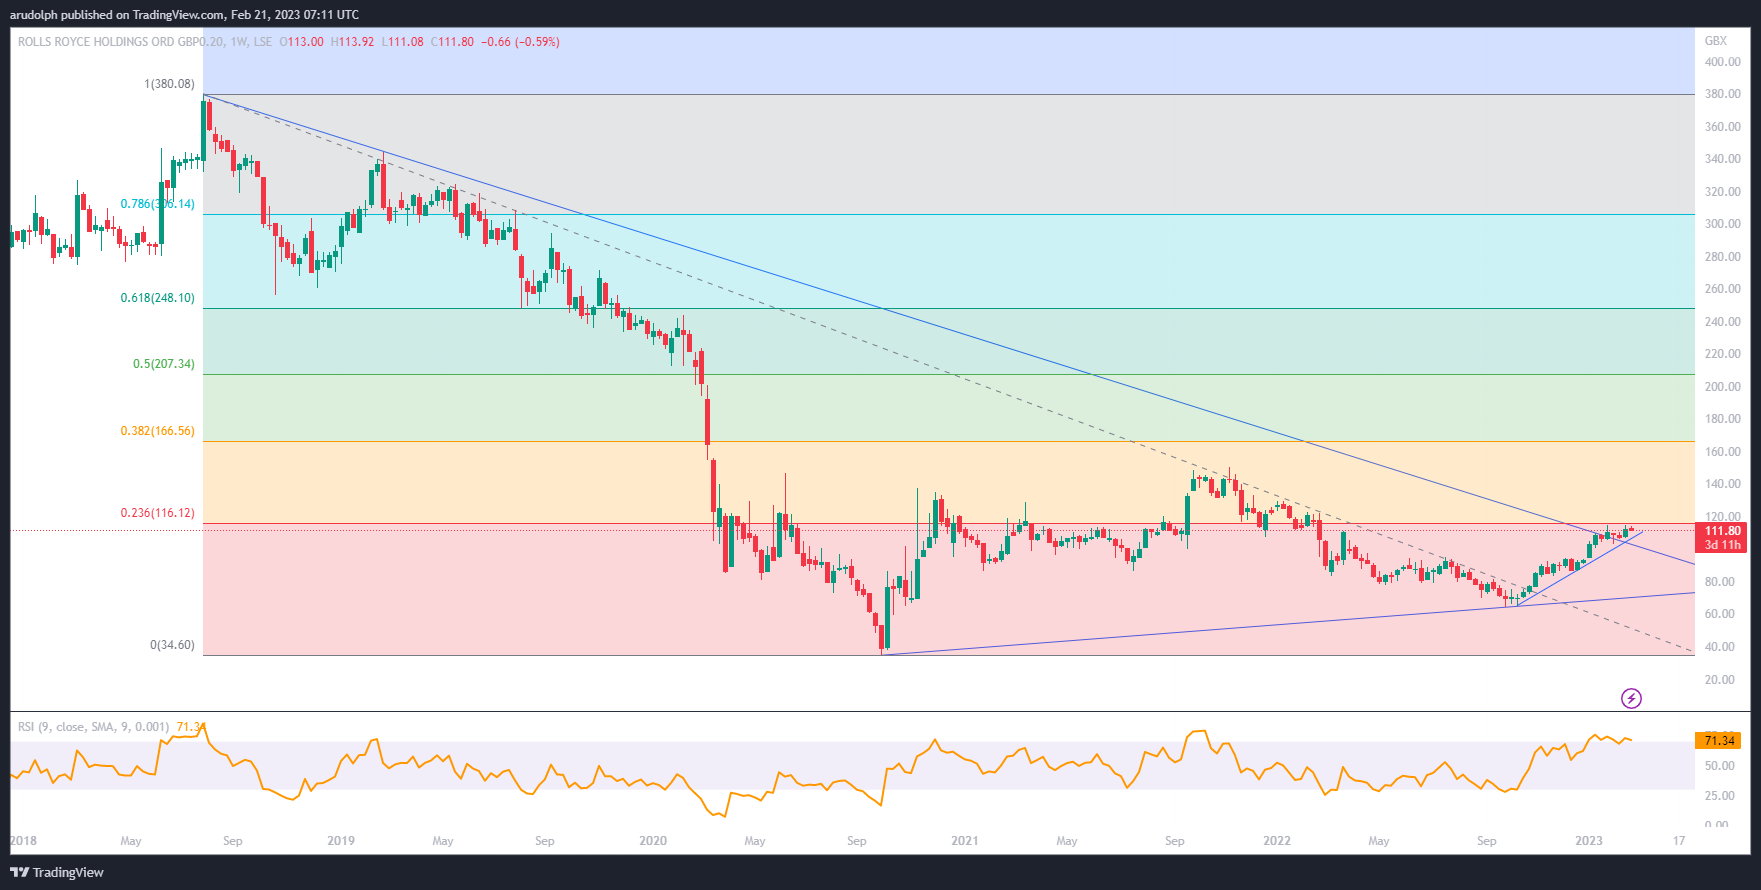 Source: Tradingview
Since 2021 the Rolls Royce share price has been oscillating within a roughly 40-to-50 pence band around the 55-week simple moving average (SMA) which continues to point downwards.
Rolls Royce shares have risen by around 80% from their October 2022 lows, though, but seem to be running out of steam below the 23.6% Fibonacci retracement of the 2018-to-2020 descent at 116.12p and the minor psychological 120p mark.
Rolls Royce Daily Chart
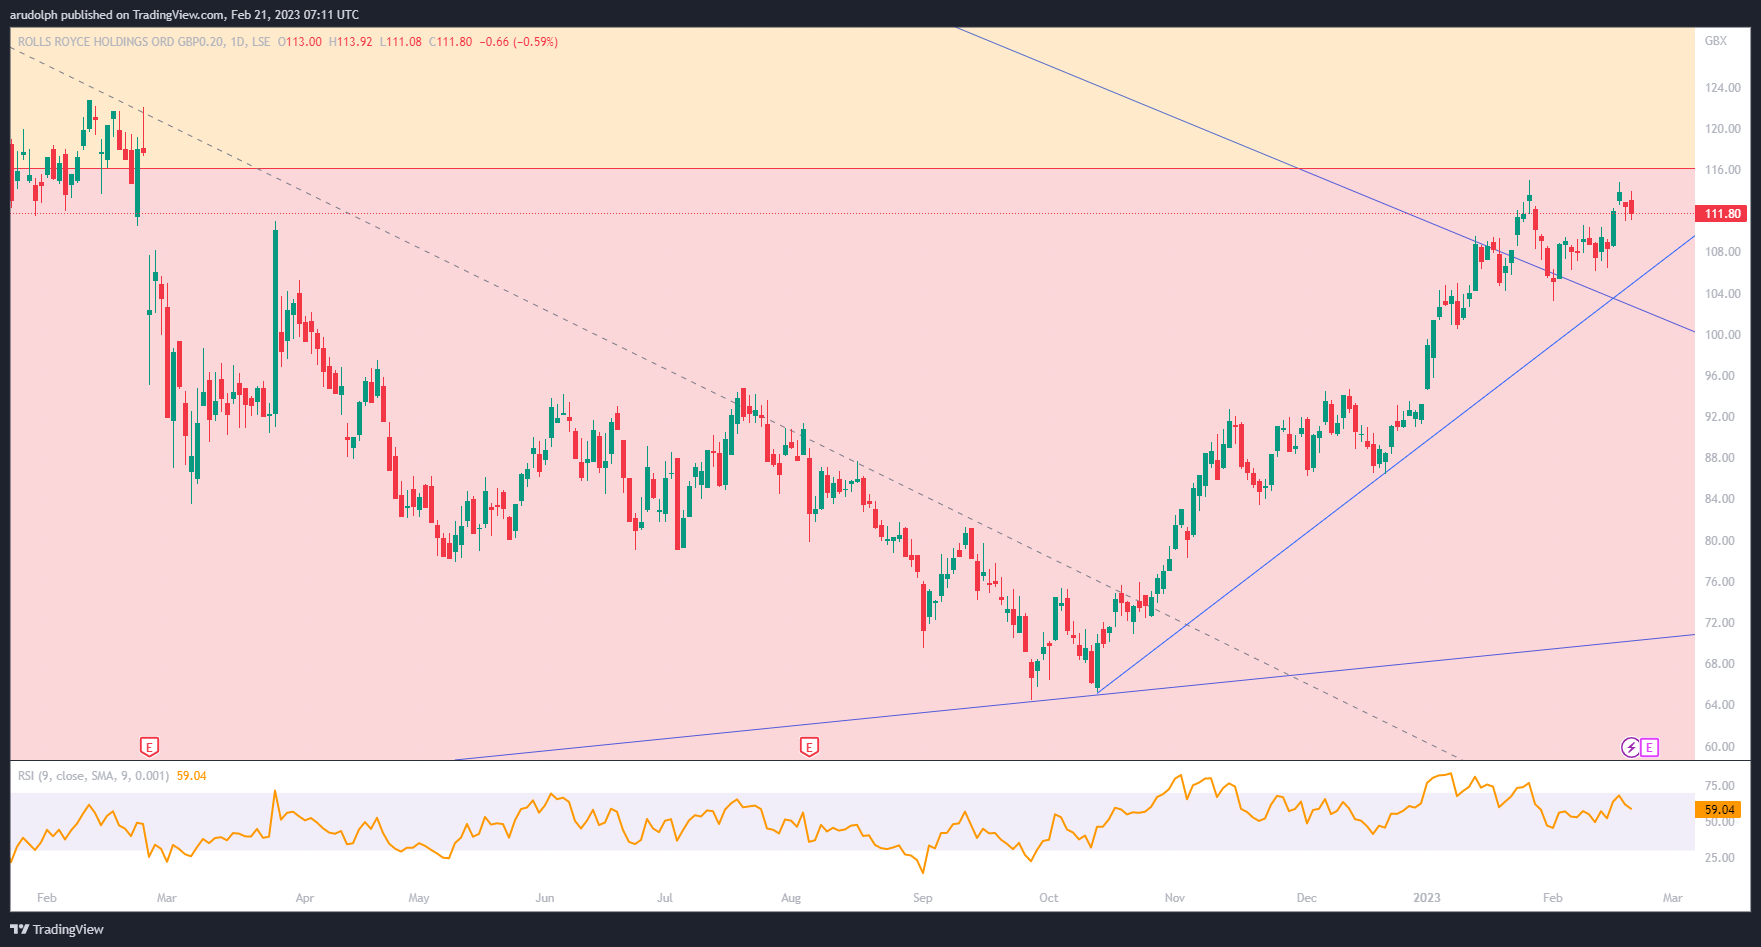 Source: Tradingview
Provided that the Rolls Royce share price remains above its 103.20p early February low on a daily chart closing basis, the October-to-February uptrend remains intact.
Were the January high at 115p to be exceeded, the February 2022 highs at 121.70p to 122.72p would be back in sight, a rise above which would engage the January 2022 high at 129.62p, ahead of the September and November 2021 peaks at 148.44p and 150.48p.
A slip through the five-month uptrend line at 105p would most likely lead to a drop below the early February low at 103.20p being seen with a retest of the breached 2018-to-2023 downtrend line, together with the 55-day simple moving average (SMA) at 102.85p to 101.46p representing possible downside targets.
Below it lies a key support zone between the June, July, November and December 2022 highs at 94.80p to 92.76p.
Summary
Rolls Royce is set to release FY 2023 results on 23 February 2023.
FY 2023 results are expected to show a revenue of £11.66 billion, up 3.97% YoY, and EPS at 0.62 pence, up 564% (YoY).
Revenue is expected to be boosted by a strong performance in its defence and power business segments due to the nearly year-long war in Ukraine with positive forward guidance likely to be seen with regards to China’s re-opening increasing demand for Rolls Royce’s products. Investors will also be curious as to see how the company’s new CEO Tufan Erginbilgic’s will deal with its £4 billion debt.
Long-term broker consensus suggests the share to currently be a ‘hold’, with a median price target of 110.00 pence for the share, roughly 2% lower than the current price (as of 21 February 2023).
94% of IG’s clients with open positions are long the share with trading activity over this week showing 68% of buys and this month 66% of sells.
The Rolls Royce share price started the year off on a strong footing and currently trades around 14% higher than at the end of December but is short-term capped below the 23.6% Fibonacci retracement of the 2018-to-2020 descent at 116.12p and the minor psychological 120p mark.
Provided that the Rolls Royce share price remains above its 103.20p early February low on a daily chart closing basis, the October-to-February uptrend remains intact, though.


.jpeg.98f0cfe51803b4af23bc6b06b29ba6ff.jpeg)

0 Comments
Recommended Comments
There are no comments to display.
Create an account or sign in to comment
You need to be a member in order to leave a comment
Create an account
Sign up for a new account in our community. It's easy!
Register a new accountSign in
Already have an account? Sign in here.
Sign In Now