Will March be a good month for the Dow, S&P 500, Nasdaq 100 and Russell 2000?

Entry posted by MongiIG in Market News
479 views
What does the remainder of Q1 2023 have in store for US equity indices?
 Source: Bloomberg
Is now the right time to buy US equity indices?
With the Dow Jones Industrial Average for the past week having traded in negative territory year-to-date as rising US yields pressured growth stocks, will other US indices follow suit or is now a good time to buy the dip?
Over a week ago this column’s author warned of a decline in US equity indices which came to fruition with all US indices trading lower by the beginning of March.
US equity indices year-to-date performance
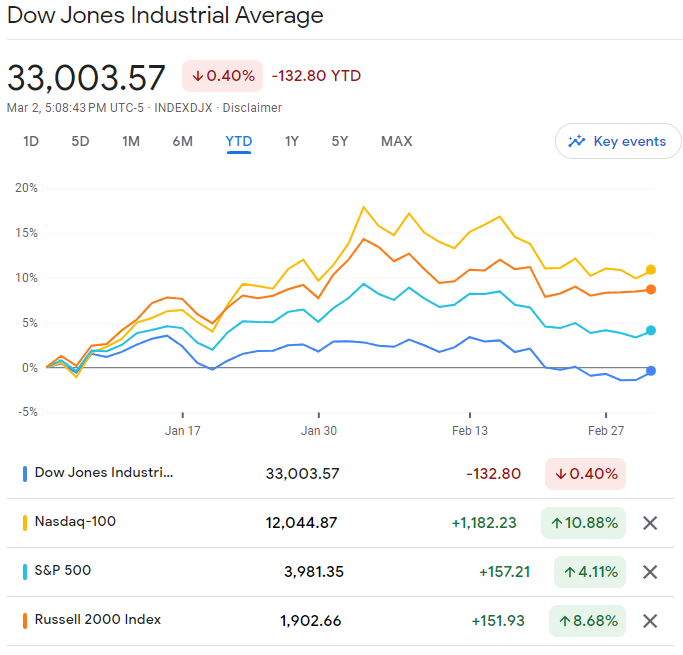 Source: Google Finance
The recent minor sell-off in equity markets has been attributed to stronger than expected US Personal Consumption (PCE) data, the Fed’s preferred inflation measure, on top of a solid US labour market and, as a result of that, a far more hawkish US Federal Reserve (Fed).
Despite US bond yields having surged to levels last seen in November 2022, with the US 10- year yield surpassing the psychological 4% barrier earlier this week, and market players expecting the fed fund rate pivot to now come in around 5.4% and no rate cuts to be seen before the beginning of 2024, US equity indices held up remarkable well as investors have been buying the dip.
What is also interesting is that the inverse correlation between the US dollar and the S&P 500 has risen to multi-month highs, meaning that while the greenback has appreciated by over 4% from its early February low, US equity indices have slipped by a similar amount.
Was February’s decline just a blip in this year’s uptrend?
With the US dollar expected to continue to rise, equity indices are likely to slide further but when looking at fund manager flows, a lot of money may still enter the stock market from bond markets in equity consolidation phases as the one seen in February.
The mid-February Bank of America (BofA) Global Fund Manager Survey showed that asset allocators cut their cash holdings and invested in emerging market stocks, especially in China, but that they were overall still broadly cautious, but less so than in recent months. In February just 24% predicted a recession compared to 77% who did in November.
Where does that leave investors?
When looking at a 20-year S&P 500 seasonality chart, the index tends to decline from mid-February to mid-March before rallying into the beginning of May.
S&P 500 Index Seasonality Chart
 Source: EquityClock.com
This has been the case in the past couple of years but since the chart refers to average performance it has to be taken with a pinch of salt.
Technical analysis may be able to provide a clearer picture, at least in the short-term, though.
Dow Jones Industrial Average
The Dow Jones Industrial Average has been underperforming its peers since the beginning of the year and is the first major index to trade back in negative territory year-to-date but may soon be trading back in positive territory.
The reason for this from a purely technical perspective is that the DOW formed a Doji candle stick pattern on Thursday, showing indecision, slightly below the December low but above the 38.2% Fibonacci retracement of the October-to December advance and the 200-day simple moving average (SMA) at 32,408 to 32,363.
Since this was followed by a bullish candle on Friday, a bounce off this support area may unfold over the coming days and weeks which may take the index back towards its December-to-February highs at 34,334 to 34,712, provided that no bearish reversal takes the index below the 200-day SMA at 32,363 on a daily chart closing basis.
If so, the June 2022 low at 29,649 would be targeted.
Resistance can be seen along the early to mid-February lows and the 55-day simple moving average (SMA) at 33,527 to 33,602.
More significant resistance is to be found at the 34,516 mid-February high.
Only a bullish reversal above the 34,516 high on a daily chart closing basis would completely void the recent downward pressure.
Dow Jones Industrial Average Daily Chart
 Source: Tradingview
S&P 500
The picture is quite similar with regards to the S&P 500 in that it is in the process of forming a bullish engulfing pattern on the daily candlestick chart, having for the second time in the past couple of weeks bounced off its 200-day SMA, marginally above the 38.2% Fibonacci retracement of the October-to-March advance at 3,926.
Provided that the S&P 500 doesn’t drop below its mid-January low at 3,886 on a daily chart closing basis, a resumption of the October-to-March uptrend may well be underway with the December peak at 4,100 being targeted, ahead of the early February high at 4,195.
S&P 500 Daily Chart
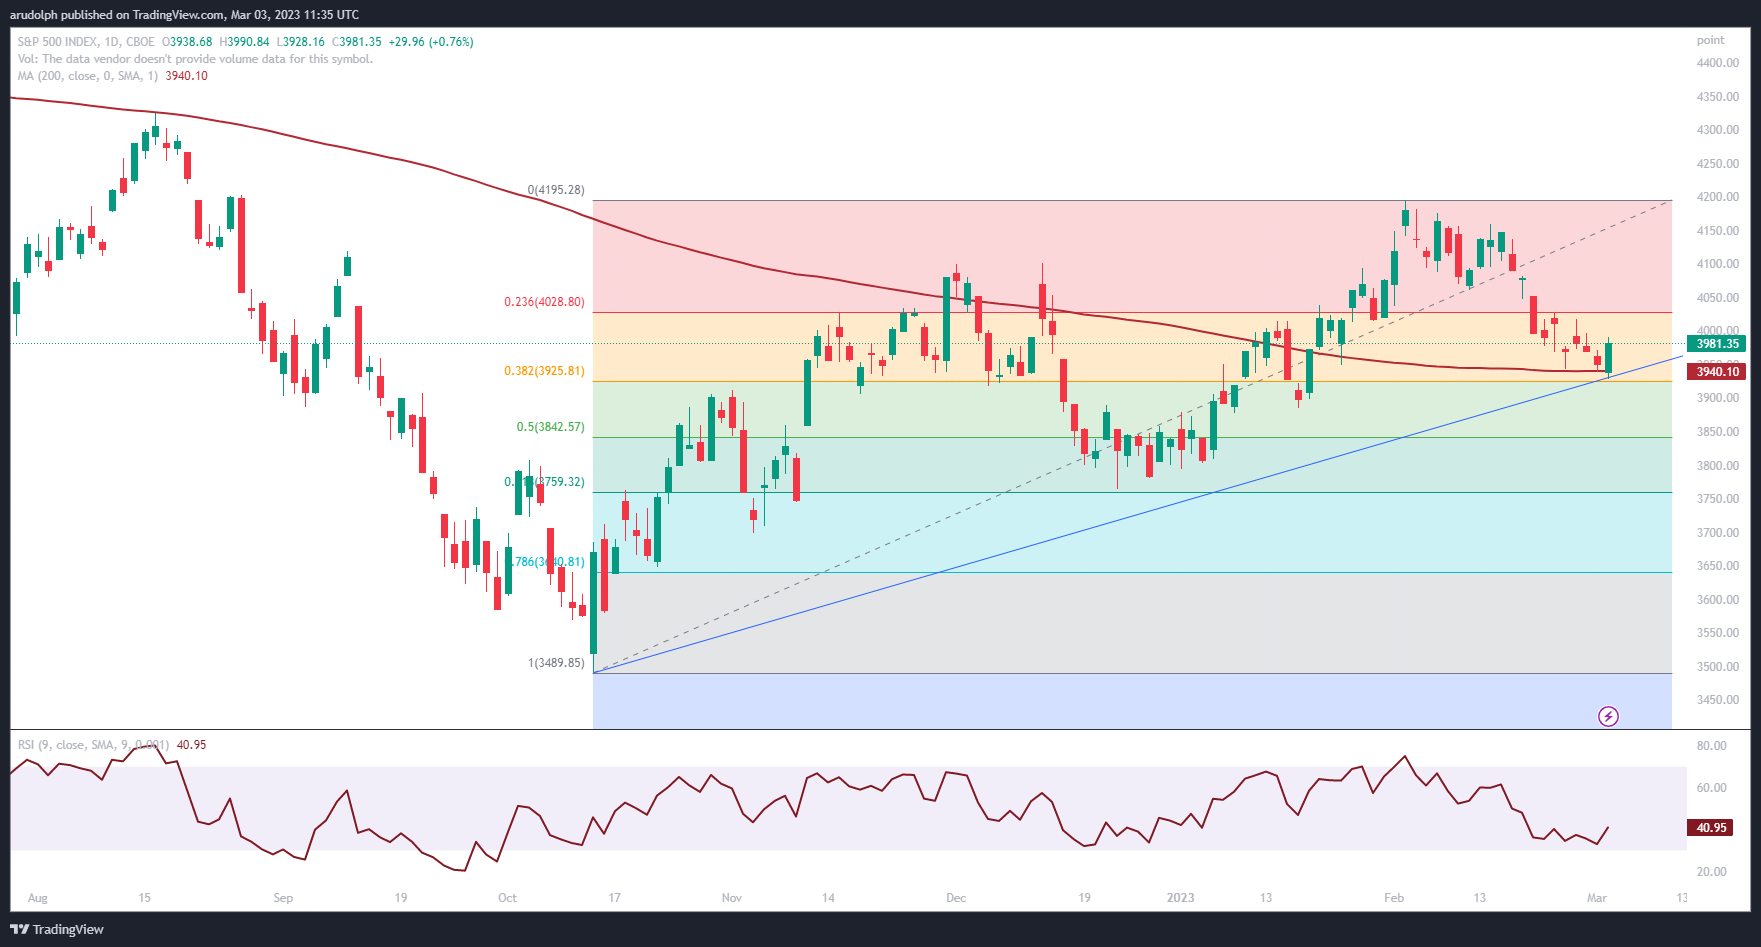 Source: Tradingview
Nasdaq 100
Thursday’s bullish engulfing pattern on the daily candlestick chart, made around the 200-day SMA at 11,902, also points towards a recovery in the Nasdaq 100, provided that the recent descent doesn’t resume and take the index to below the 25 January low at 11,550 on a daily chart closing basis.
If so, the odds would favour further downside with the October-to-January lows at 10,697 to 10,441 then being back in sight.
Upside targets are the December peak at 12,166, followed by the February peak at 12,880.
Nasdaq 100 Daily Chart
 Source: Tradingview
Russell 2000
The Russell 2000, which by mid-January was outperforming other US indices, including the Nasdaq 100, has also give back nearly half of its gains before levelling out this and last week.
Provided that the index can remain above the 200-day SMA, 50% retracement of its October-to-February advance and the 19 January low at 1,827 to 1,825 on a daily chart closing basis, renewed upside seems to be in store with the February peak at 2,007 being back on the cards.
Russell 2000 Daily Chart
 Source: Tradingview


.jpeg.98f0cfe51803b4af23bc6b06b29ba6ff.jpeg)

0 Comments
Recommended Comments
There are no comments to display.
Create an account or sign in to comment
You need to be a member in order to leave a comment
Create an account
Sign up for a new account in our community. It's easy!
Register a new accountSign in
Already have an account? Sign in here.
Sign In Now