Hawkish takeaway from Fed Chair Powell’s testimony: US dollar, USD/JPY, Gold and Silver

Entry posted by MongiIG in Market News
437 views
Comments from Fed Chair Jerome Powell triggered a risk-off session in Wall Street overnight, as his testimony was perceived to be a hawkish takeaway.
 Source: Bloomberg
Market Recap
Comments from Federal Reserve (Fed) Chair Jerome Powell triggered a risk-off session in Wall Street overnight, as his testimony was perceived to be a hawkish takeaway, which drove another round of hawkish recalibration in rate expectations. The Fed Chair acknowledged that the latest economic data have come in stronger than expected, which suggests that the “ultimate level of interest rates is likely to be higher than previously anticipated”. He also stated that the Fed “would be prepared to increase the pace of rate hikes” if warranted by the data. That seems to be a shift in tone from his previous acknowledgement of the ‘disinflation process’, which provided the go-ahead for the Fed funds futures market to lean towards a 50 basis-point (bp) hike in March (62% probability) from the previous 25 bp, while also pricing for a higher terminal rate at the 5.5-5.75% range.
With that, US Treasury yields and the US dollar saw a spike higher, with the two-year yields back at its highest level since 2007. For the US dollar, it has moved to challenge its key resistance at the 105.00 level once more, delivering its highest level in two months. Its 100-day moving average (MA) has also been breached for the first time since November last year. That could leave the dollar to set its sight on the 200-day moving average (MA) next, leaving the 106.60 level on watch.
 Source: IG charts
The US job report this Friday will be in focus next. Any pull-ahead in job gains, in the likes of January’s number, will likely anchor down a 50 bp hike in March and pushed for further de-risking. Current expectations are pointing to 203,000 job gains, while average hourly earnings to remain unchanged at 4.8% year-on-year. Any upside surprise will run the risks of further adjustment in rate expectations towards a higher range, which will not be welcomed by equity bulls.
Asia Open
Asian stocks look set for a flat to negative open, with Nikkei +0.11%, ASX -0.86% and KOSPI -1.10% at the time of writing. Chinese equities have failed to sustain its gains lately, as a significant downside surprise in China’s imports figure yesterday challenged reopening optimism (-10.2% versus -5.5% forecast) by suggesting that recovery may be more gradual. Coupled with the negative handover from Wall Street overnight, further downside pressure could likely remain in place in today’s session.
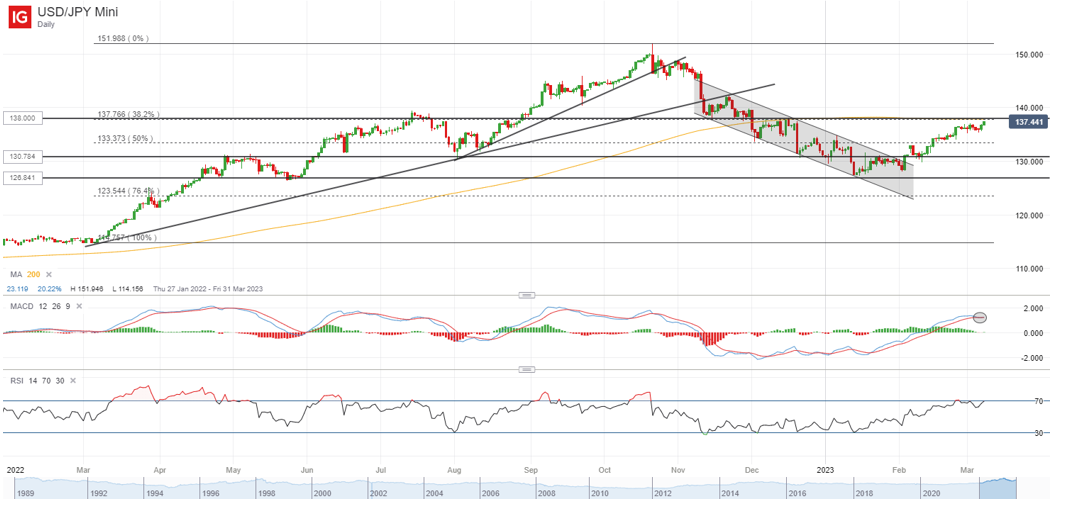
The AUD/USD has failed to move back above its 200-day MA, witnessing a double-whammy from a ‘dovish hike’ by the Reserve Bank of Australia (RBA) and a more hawkish Fed. A subtle change in policy wording led to expectations of an impending rate pause over the next two meetings. On the other hand, a hawkish boost to the US dollar has brought the USD/JPY to retest its resistance confluence zone at the 138.00 level. This is where its key 200-day MA stands in coincidence with a 38.2% Fibonacci level. Much will depend on if the 138.00 level could be overcome ahead, which may then pave the way towards the 142.20 level next.
 Source: IG charts
On the watchlist: Another round of hawkish recalibration in rate expectations dragged precious metals lower
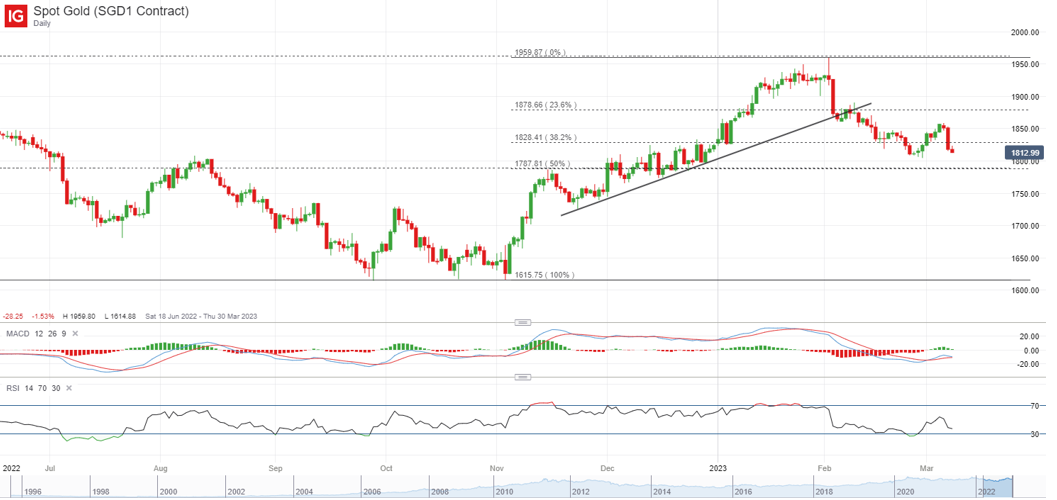
Another round of hawkish recalibration in market rate expectations did not bode well for rate-sensitive gold and silver prices overnight, which reacted to the downside by 2% and 5% respectively. A spike in Treasury yields and US dollar are headwinds for the precious metals. For gold prices, it has pared all of its previous week’s gains, seemingly heading to retest its February low. A break below that could point to a formation of a new lower low, which reiterates its near-term downward trend. A greater line of support could be presented at the US$1,780 level, where its 200-day MA stands.
 Source: IG charts
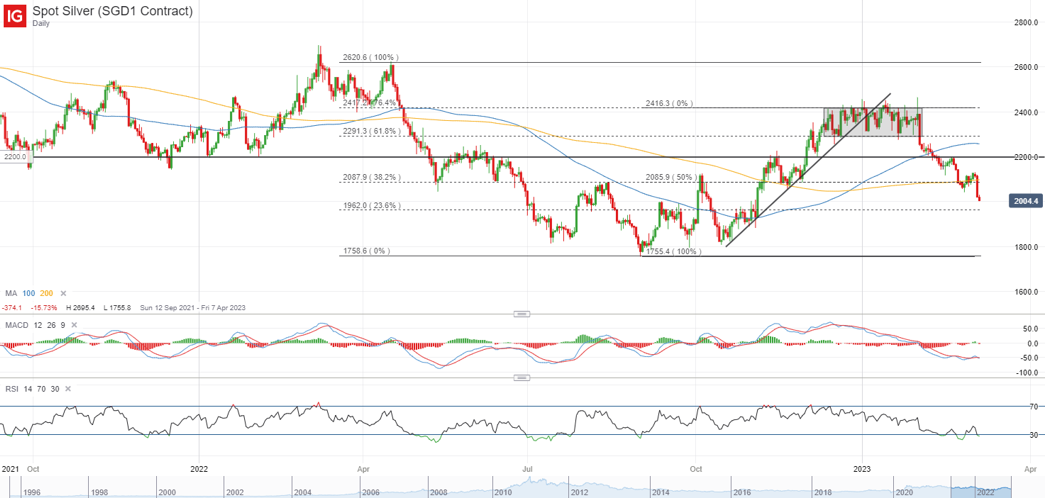
Similarly for silver, prices have breached a key Fibonacci confluence zone at the US$20.85 level, seemingly setting its sight on the US$19.60 level next. Its 200-day MA has given way yesterday, which supports a bearish bias, along with its ongoing lower high, lower low narrative being intact. Further breach below the US$19.60 level could place its previous triple bottom formation at the US$18.15 level in focus next.
 Source: IG charts
Tuesday: DJIA -1.72%; S&P 500 -1.53%; Nasdaq -1.25%, DAX -0.60%, FTSE -0.13%


.jpeg.98f0cfe51803b4af23bc6b06b29ba6ff.jpeg)


0 Comments
Recommended Comments
There are no comments to display.
Create an account or sign in to comment
You need to be a member in order to leave a comment
Create an account
Sign up for a new account in our community. It's easy!
Register a new accountSign in
Already have an account? Sign in here.
Sign In Now